The Fed keeps rates steady but lowers U.S. growth forecast

Redacción Mapfre
Eduardo García Castro, expert economist de MAPFRE Economics
The United States Federal Reserve (the Fed) once again kept the benchmark interest rates in the 4.25%-4.50% range for the fourth consecutive time, although with less consensus among members of the Federal Open Market Committee (FOMC). Regarding the balance sheet, no changes were announced, so the pace of quantitative tightening (QT) will continue as planned, with $5 billion in sales. Alongside the monetary policy decision, the Fed released its interest rate projections through the Dot Plot, which maintains the expectation of 50 basis points (bps) in rate cuts in 2025, 25 bps in 2026 (one less than before), and 25 bps in 2027, with the long-term rate remaining around 3% (see Chart 1).
Chart 1: Dot Plot
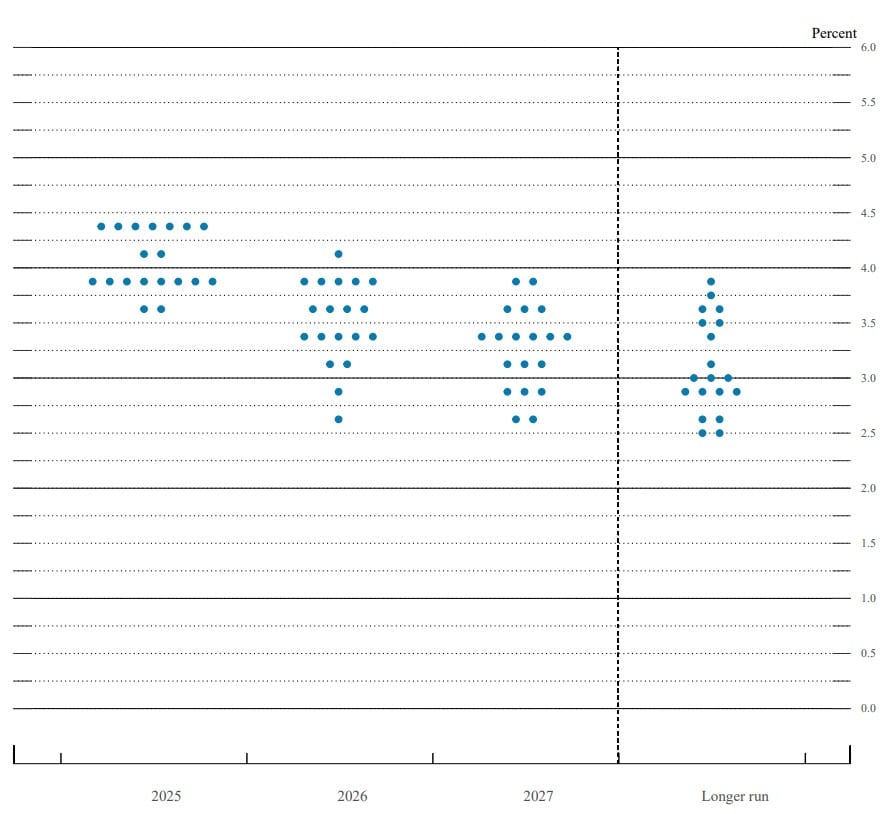
Source: MAPFRE Economics (based on Federal Reserve data)
Additionally, the Fed shared a new macroeconomic forecast chart, which suggests some influence from tariffs. Specifically, it shows a downward revision in economic growth forecasts (reduced to 1.4% in 2025 and 1.6% in 2026, from the previous 1.7% and 1.8%), and higher inflation (3.0% and 2.4%, respectively, compared to the earlier 2.8% and 2.2%).
In subsequent comments, the committee defended the need to maintain a patient and watchful stance as the best option for monetary policy given the current context of uncertainty (see Chart 2) and to guide policy accordingly in the future. With economic growth remaining solid, a labor market that “is not urgently calling for a rate cut,” and inflation continuing to decline but still somewhat elevated, doubts focus on the need for greater clarity on trade policy as well as the potential effects tariff policies may have in the future. In fact, the committee reiterated the argument that “someone will have to pay the cost of tariffs,” which will ultimately affect economic activity and price levels. However, until the real effects are known, it is not appropriate to commit to any future decision.
Chart 2: Trade uncertainty
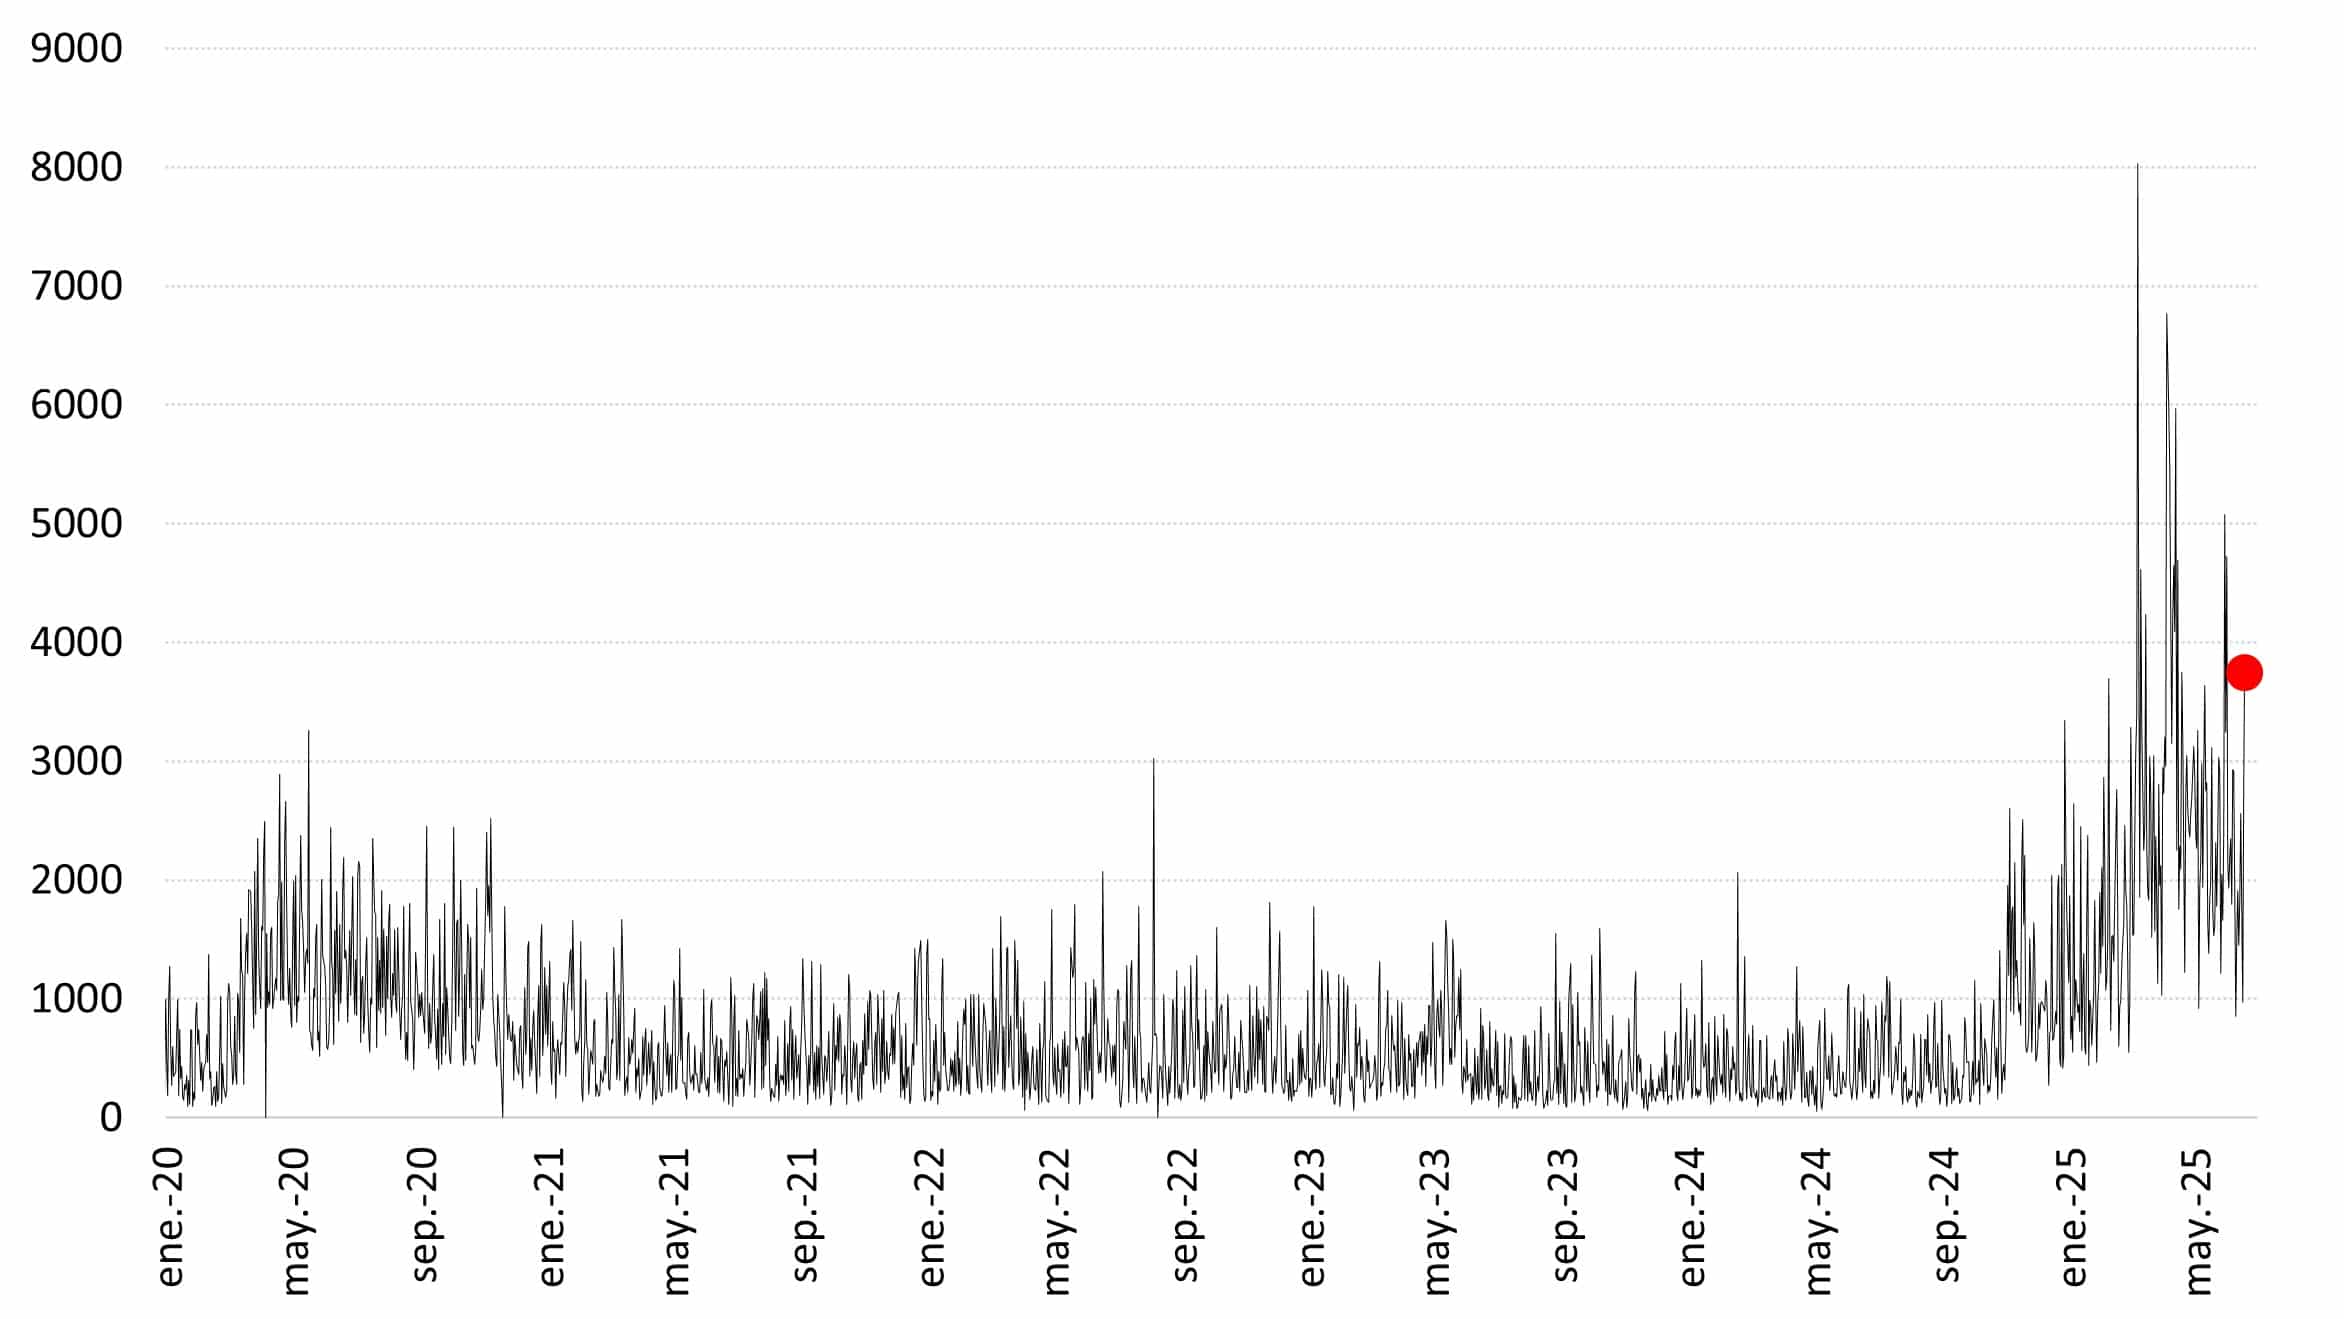
Source: Source: MAPFRE Economics (with EPU data)
Assessment
Recent growth and employment data do not suggest an immediate need to change the course of U.S. monetary policy; in fact, they seem to have adjusted to an environment of elevated rates. Inflation, although it has remained on a downward trend, is still high and continues to be wrapped in uncertainty related to tariffs. These arguments are also reinforced by the recent rebound in oil prices following the resurgence of geopolitical risk in the Middle East. Based on this environment, along with other effects related to fiscal and immigration policies, a cautious approach remains the most consistent in the face of the possibility of preventive moves.
May employment data showed a relatively stable unemployment rate (4.2%) and positive job creation (139,000). These figures align with long-term goals and therefore do not alter the Fed’s forecasts. Regarding weekly June reports, although there was a slight deterioration in data (with continuing unemployment claims rising to 1.9 million), the figures are still not worrisome; in fact, they may be symptomatic of a return to equilibrium. Similarly, the JOLTS report showed a stabilization in labor market trends regarding job openings for the unemployed, remaining at 1.0; meaning job supply and demand are balanced (see Chart 3).
Chart 3: JOLTS employment report data
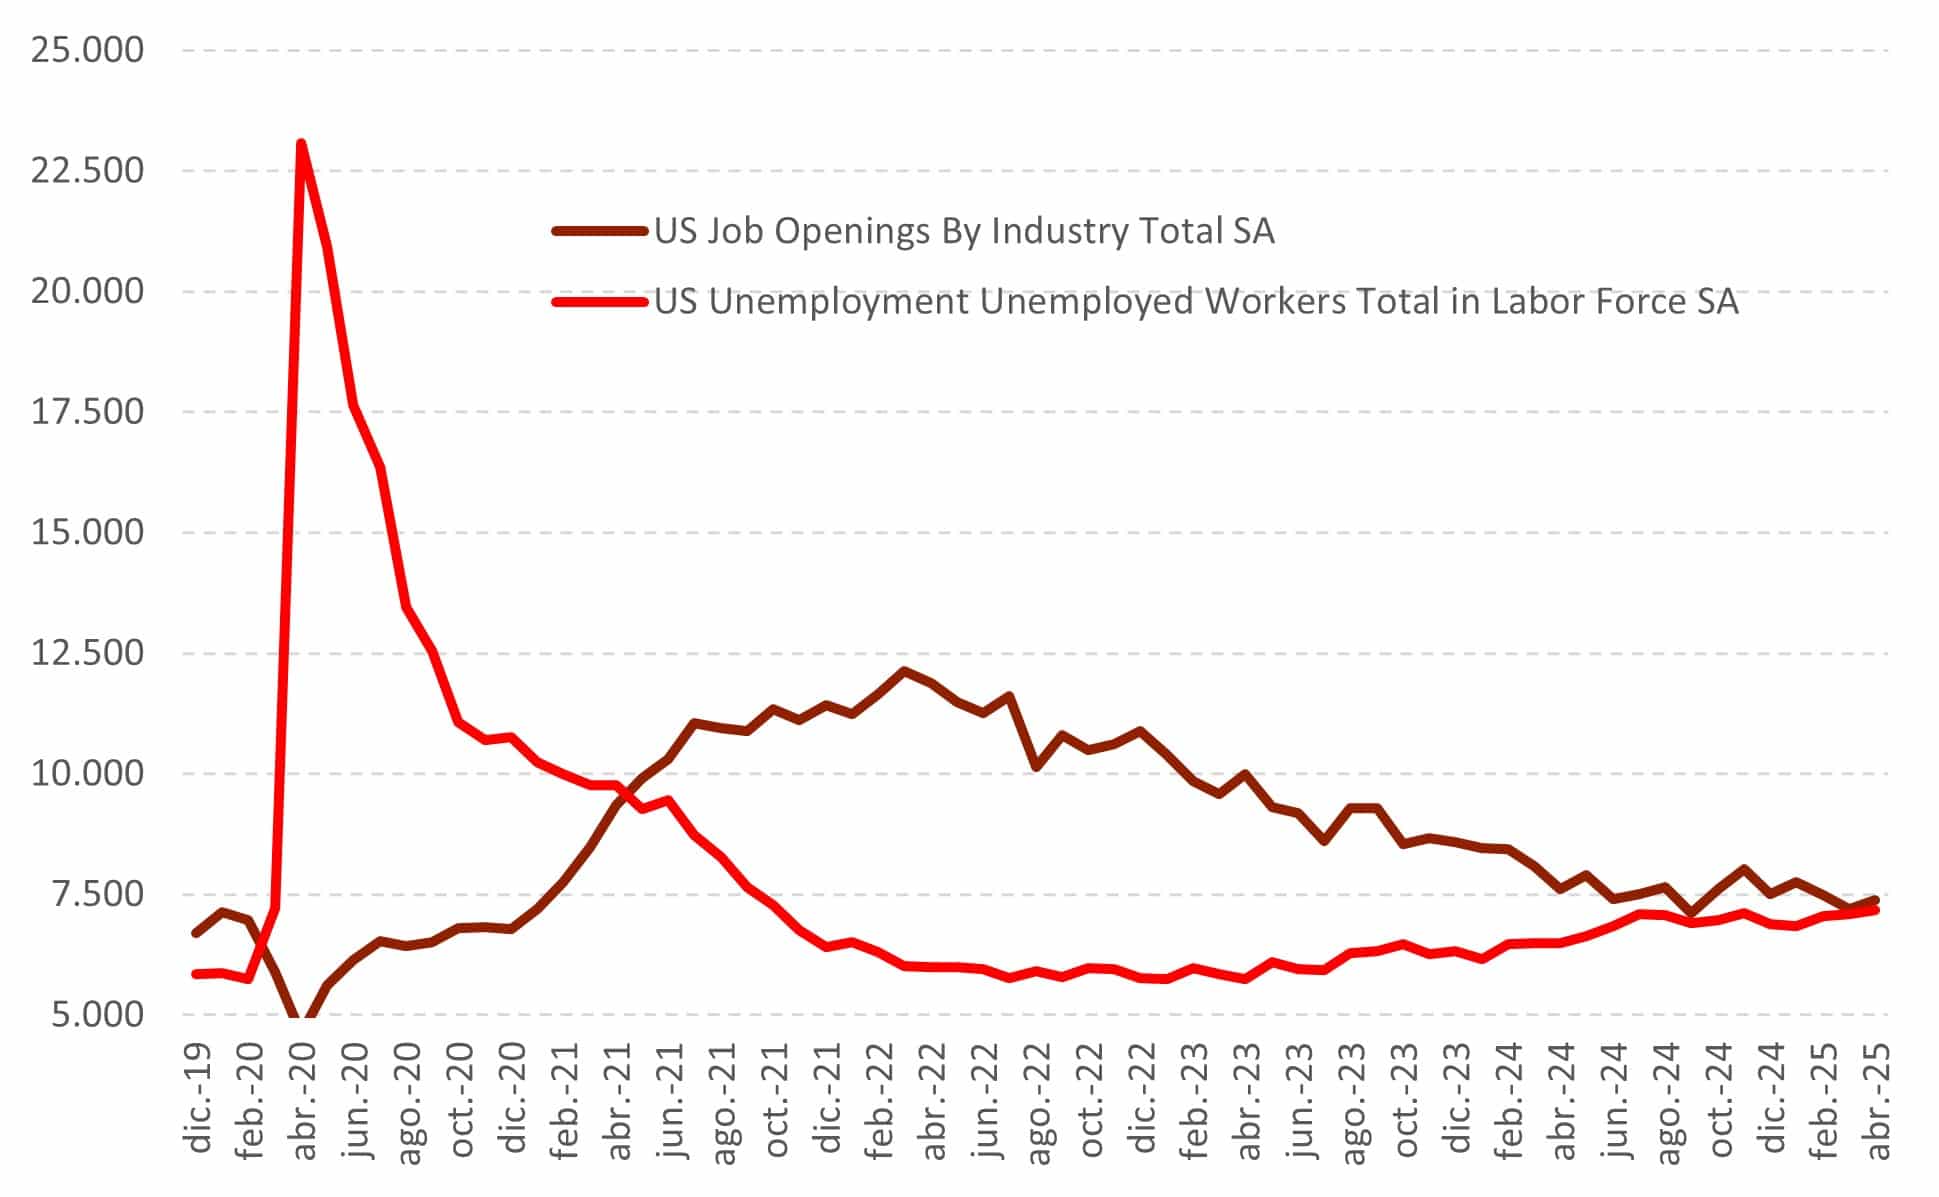
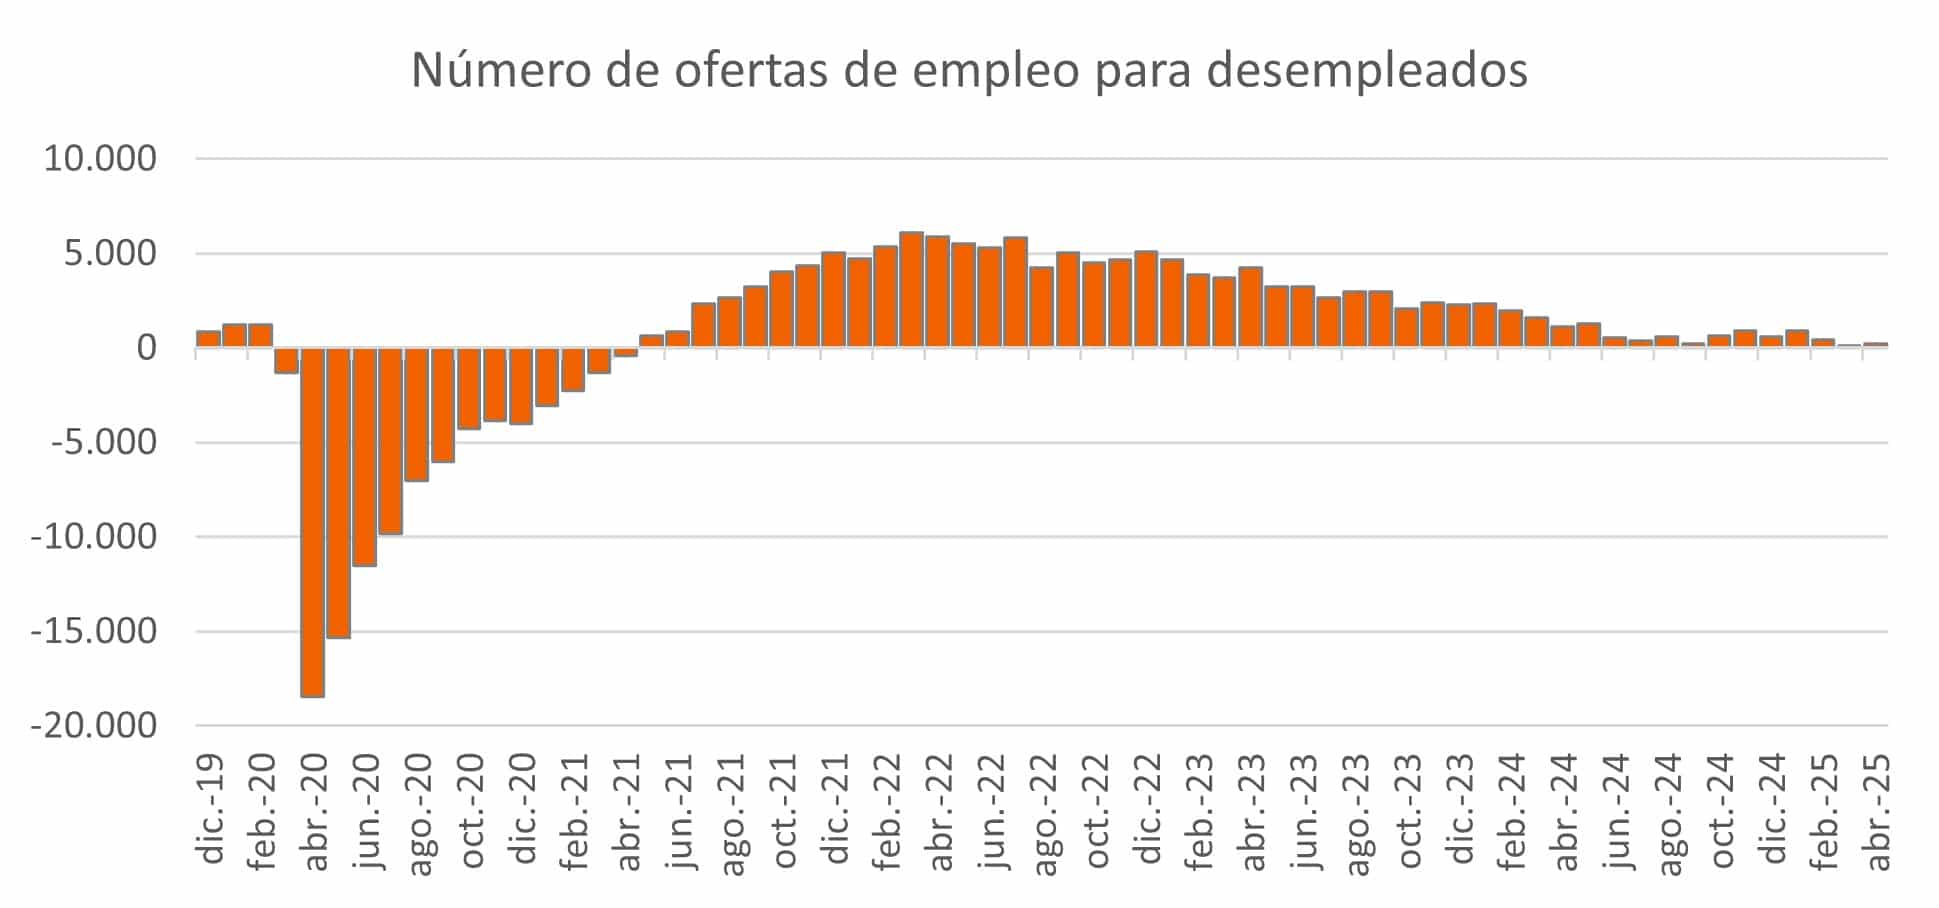
Source: MAPFRE Economics (with Haver data)
Regarding activity, recent data suggest the economy continues to expand at a good pace, but growth may have lost some momentum. On the positive side, as illustrated in Chart 4, the services PMI rose to 53.7 in May (from 52.3 previously), while manufacturing PMI increased to 52.0 (from 50.2). On the other hand, retail sales fell 0.9% in May (second consecutive monthly decline) and industrial production dropped by 0.2%. This combination led the Atlanta Fed’s GDPNow estimate for Q2 to fall slightly to an annualized rate of 3.5% (from 3.8%).
Chart 4: U.S. PMIs
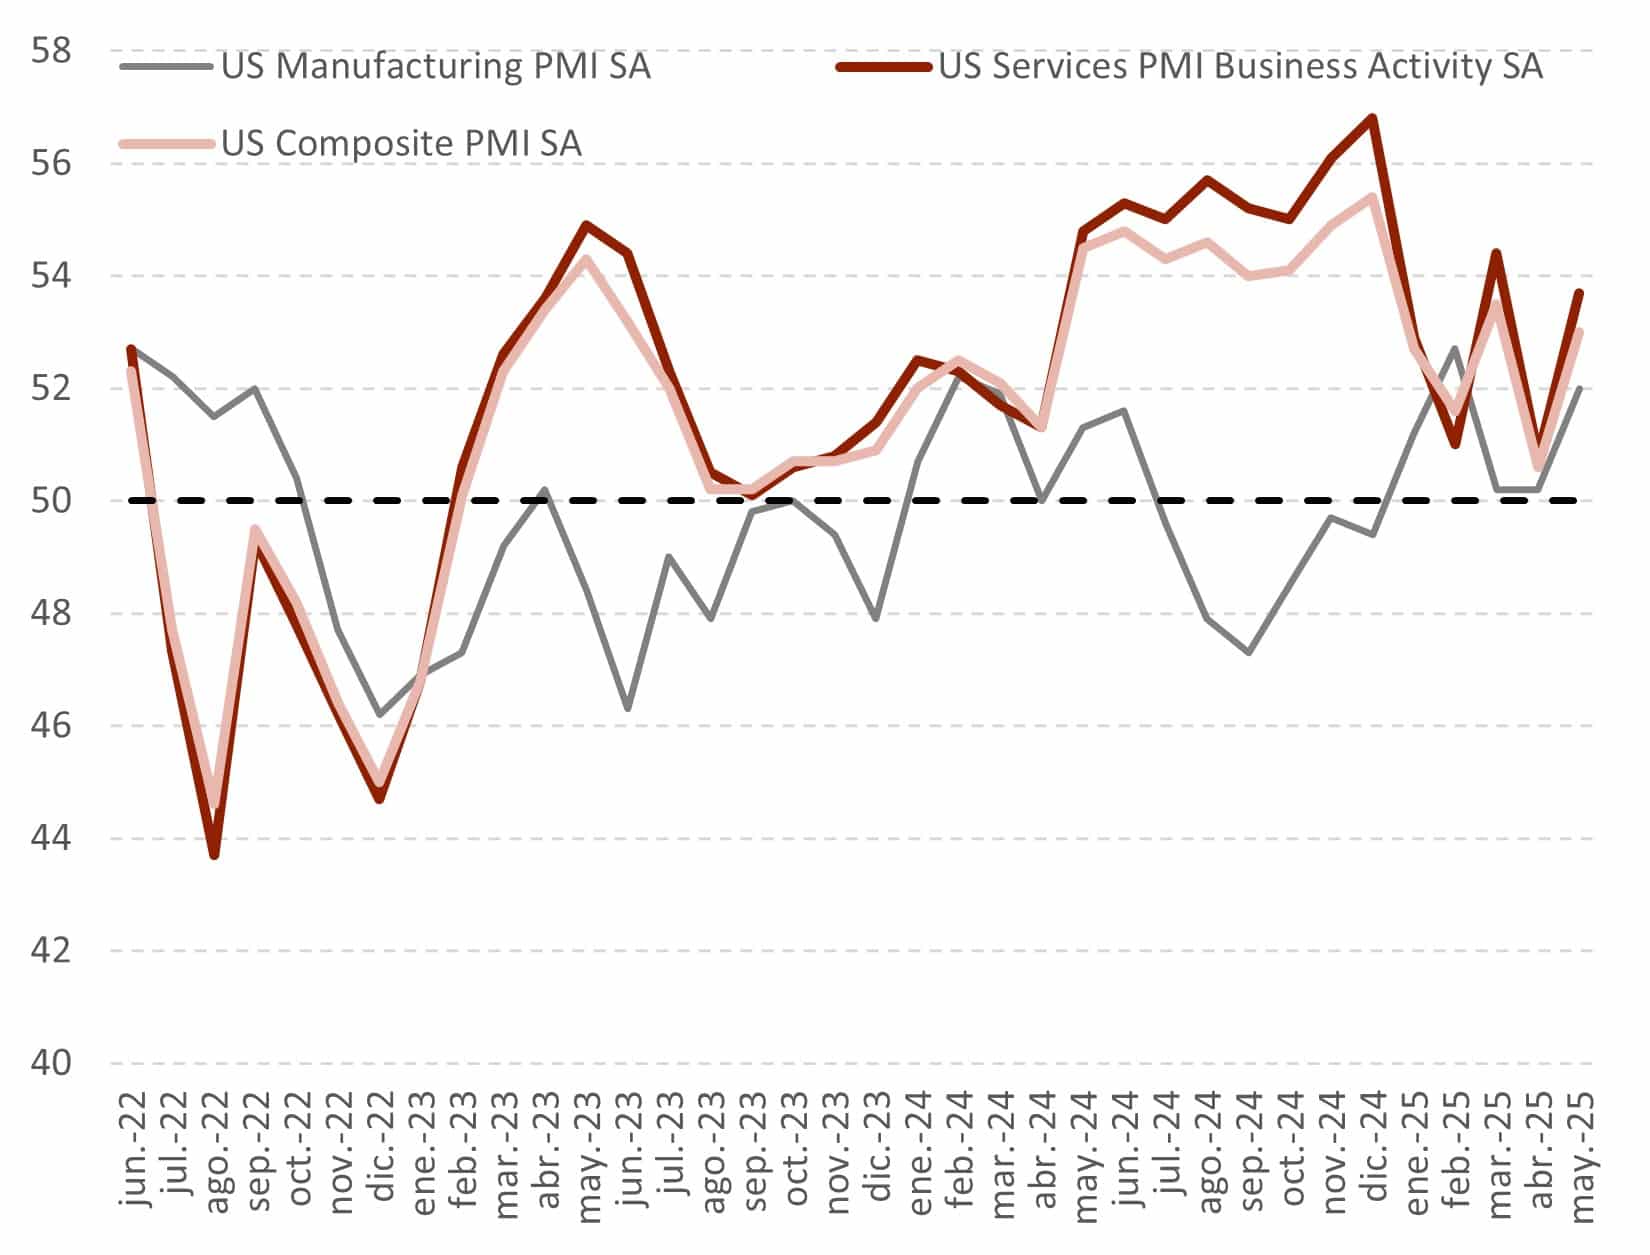
Source: MAPFRE Economics (based on Bloomberg data)
Regarding inflation (see Chart 5), the overall CPI rose by one-tenth of a percent in May, reaching 2.4% year-on-year, mainly due to the decline in the energy index (-1.0% month-on-month and -3.5% year-on-year), nearly unchanged goods prices (0.1% month-on-month), and further moderation in services (0.2% month-on-month) and housing (0.3% month-on-month). Core inflation also recorded a month-on-month rise of 0.1% (2.8% year-on-year), continuing to reflect increasingly moderate price pressures. In this regard, although inflation has not yet disappeared, it continues to reach new lows since the inflationary cycle began, showing no impact from the new tariff framework so far. However, it would be unwise to highlight the lack of effects, as anticipated inventory buildup and continuing tariff uncertainty may be delaying the pass-through to final prices.
Chart 5: Inflation in the United States by components
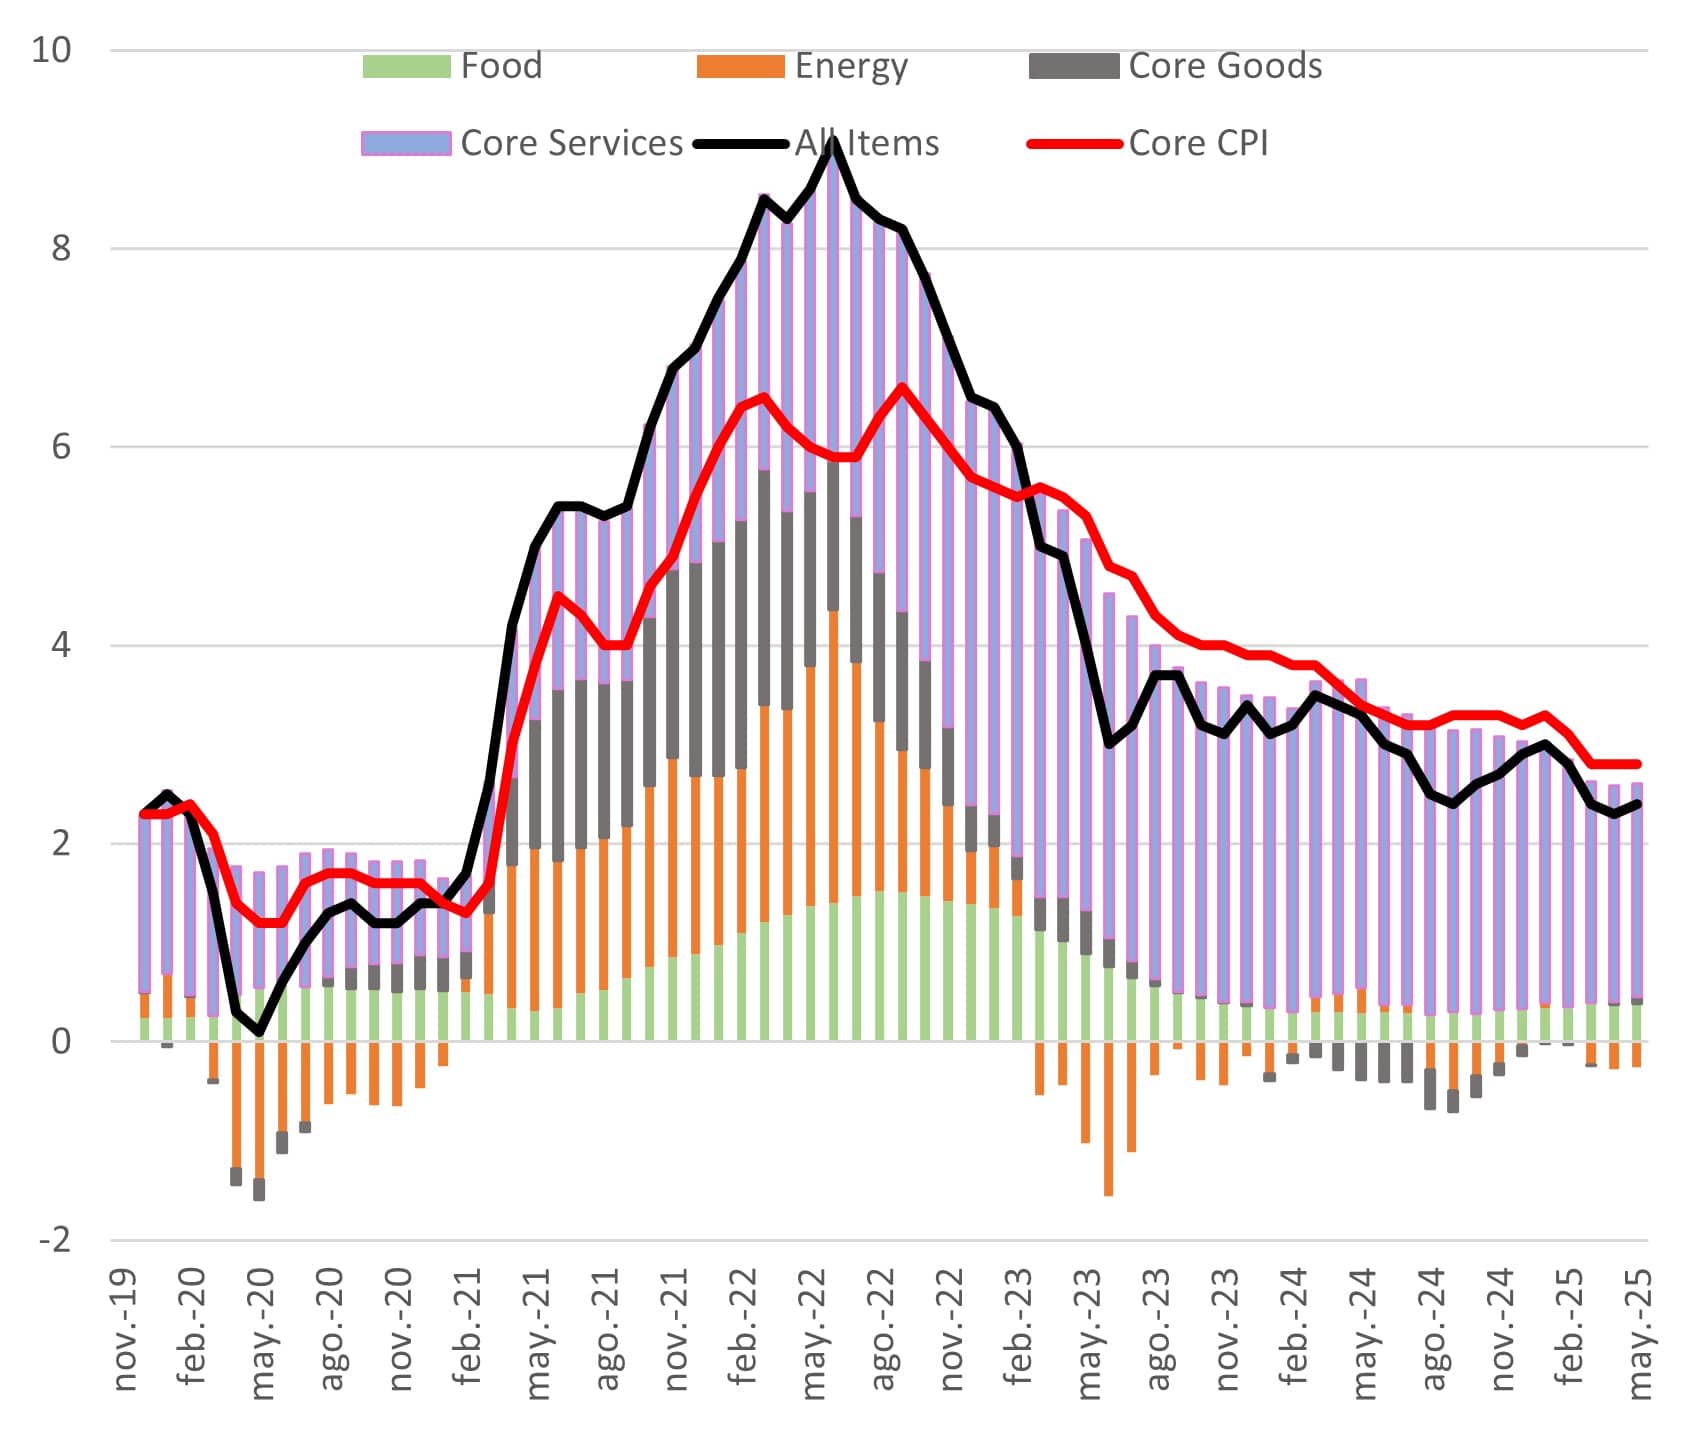
Source: MAPFRE Economics (with Haver data)
Additionally, it is worth noting the recent Moody’s downgrade of U.S. credit ratings, citing debt near historic highs and deficits on an unsustainable long-term trajectory. This contrasts with the Trump administration’s current aims to launch a new fiscal stimulus under the BBB package, which, as shown by rising bond yields, highlights the Fed’s current difficulties balancing risks with policy decisions, a difficult situation likely to further strain the relationship between fiscal and monetary policy in the future. In fact, questions about how the U.S. would overcome that deficit with economic growth, alongside lower capital inflows to finance it, constitute a risk dynamic starting to consolidate both in the dollar’s yields and real yields (see Chart 6).
Chart 6: USD vs. 10-Year
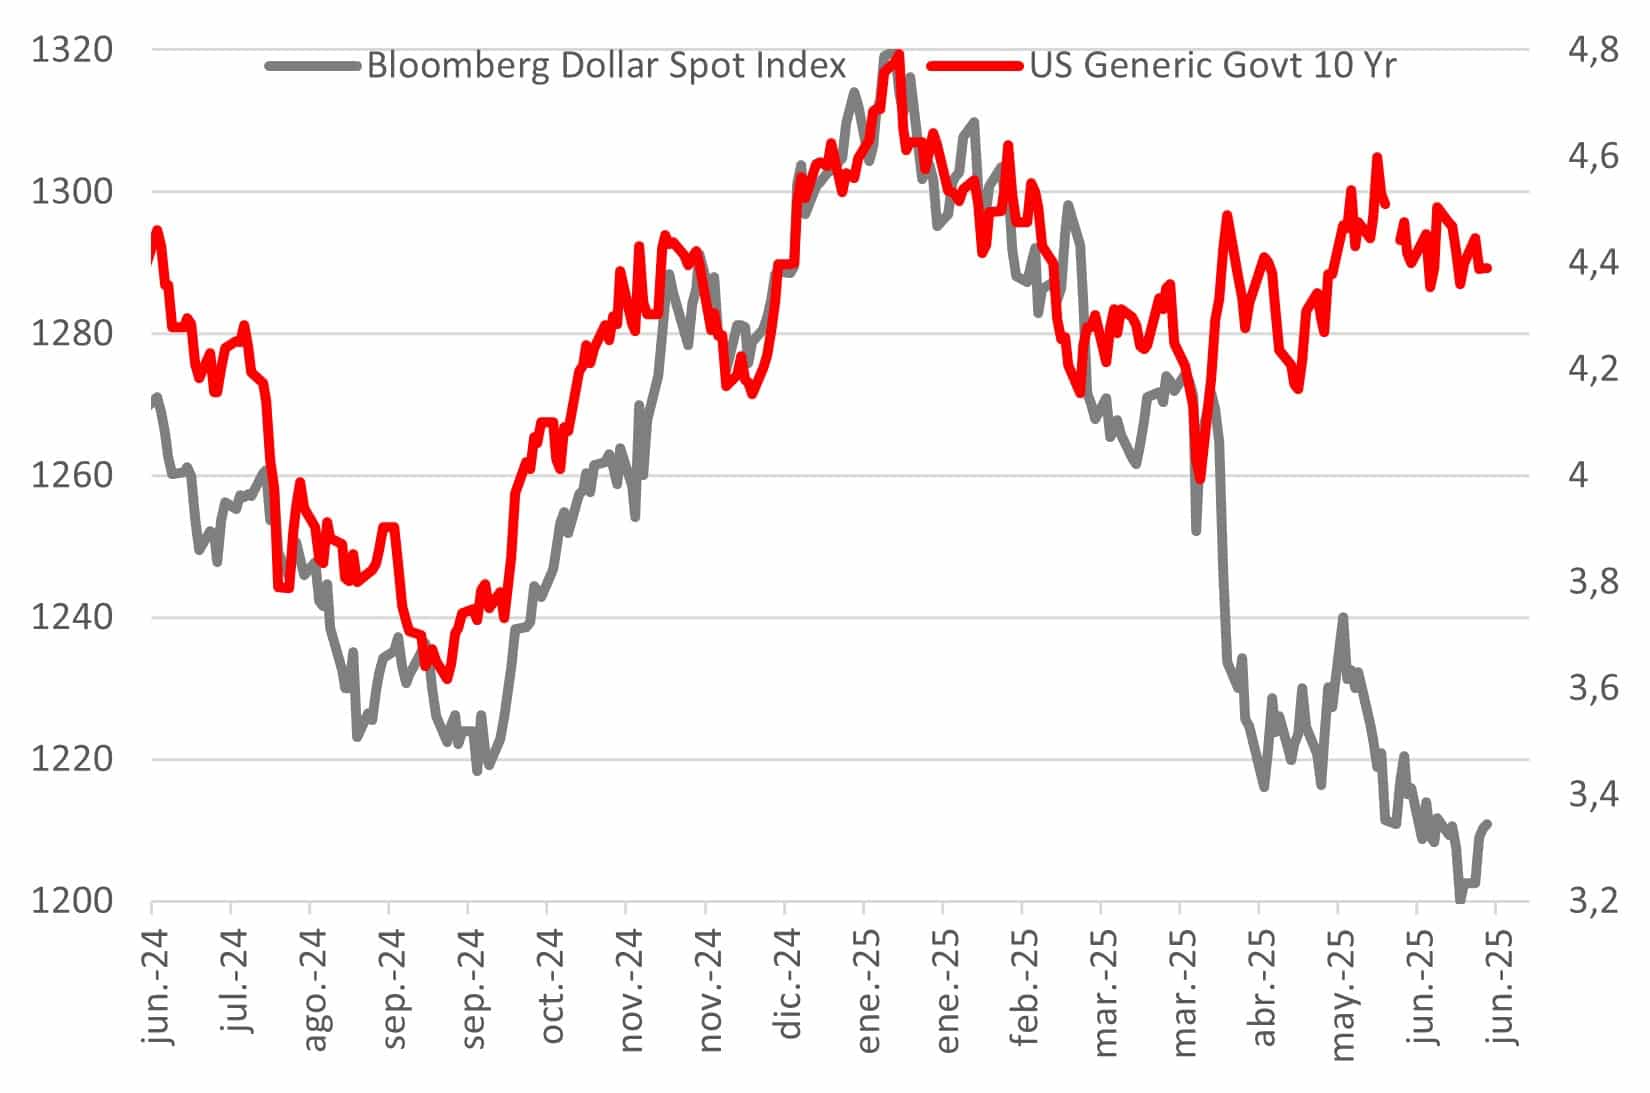
Source: MAPFRE Economics (based on Bloomberg data)
In summary, recent macroeconomic data indicate an economy in equilibrium, with inflation continuing on track toward the target but with relative uncertainty on most internal and external policy fronts. This equilibrium is also reflected in the theoretical interest rate range provided by the Taylor Rule in its various versions, currently indicating that the effective rate remains within the theoretically appropriate range (see Chart 7).
Chart 7: Current interest rate and estimates according to the Taylor Rule
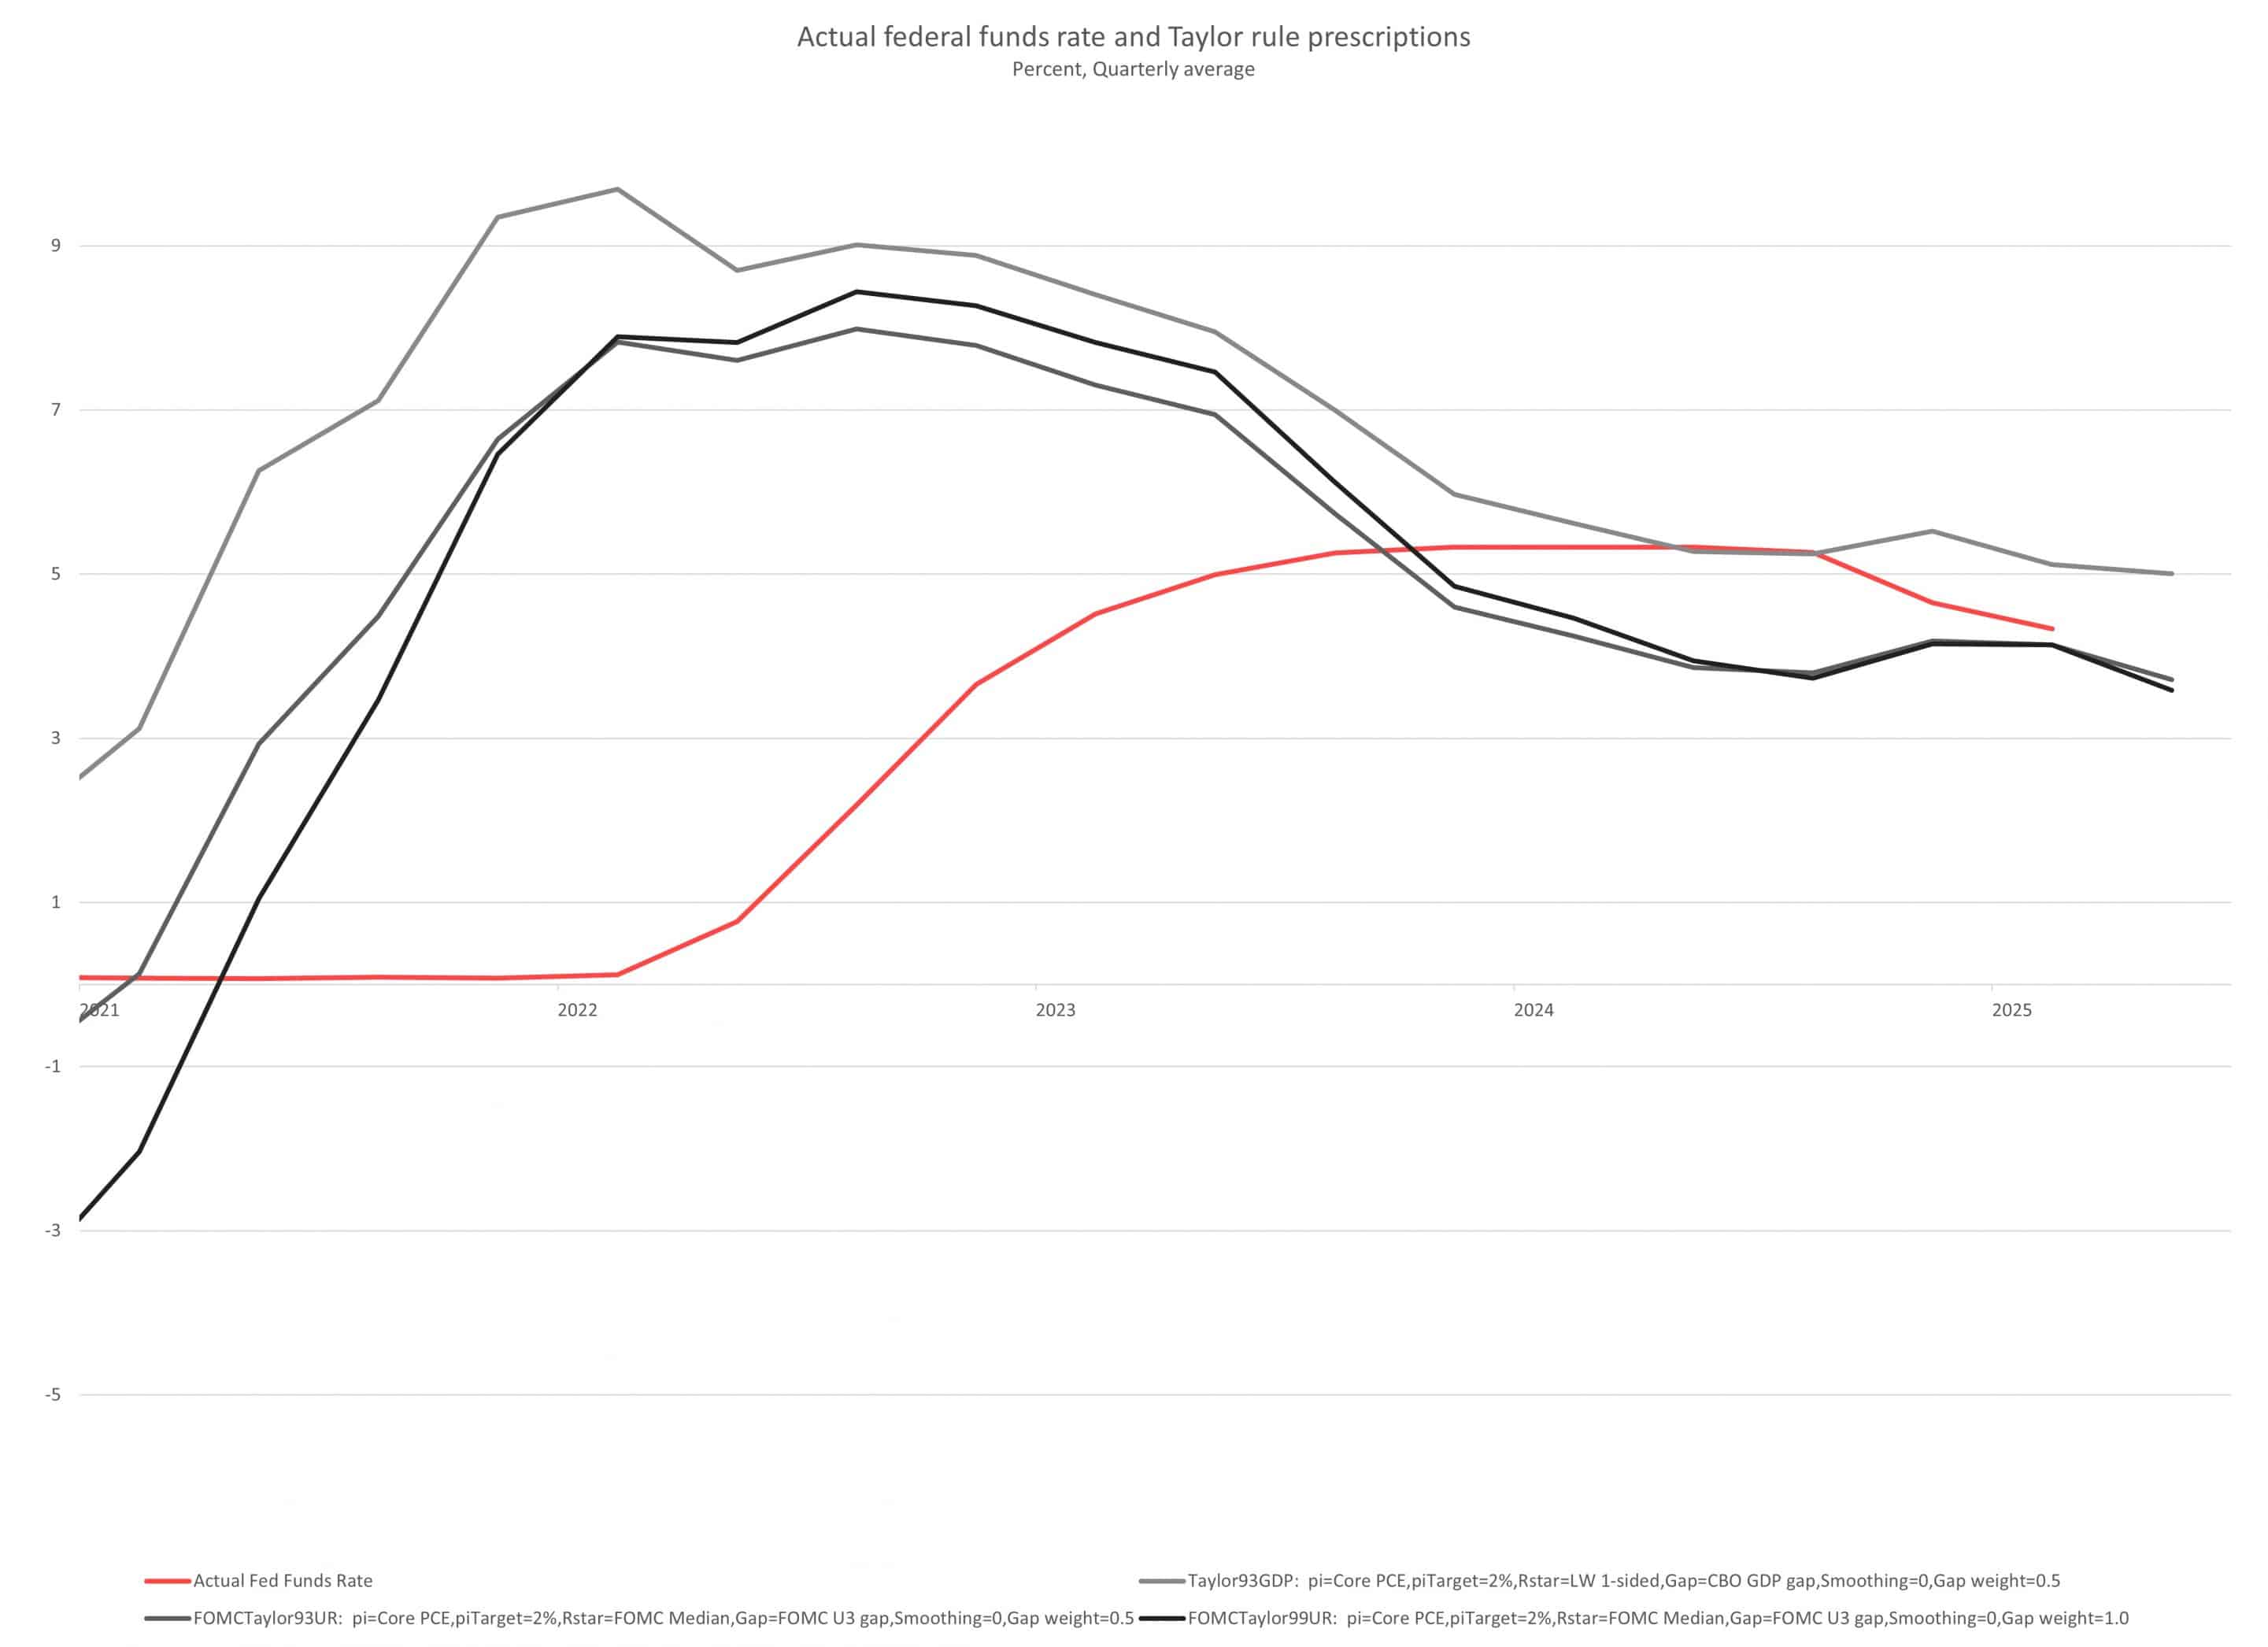
Source: MAPFRE Economics (based on Atlanta FED data)
Therefore, the Federal Reserve faces the need to continue in its holding pattern until the true effects become clear, especially considering there is currently no clear consensus among its members. Until that changes, predictability will remain low, but the fact that the new dot plot is not particularly far from market expectations offers some evidence that both credibility and independence remain intact (see Chart 8).
Chart 8: SWAP-discounted interest rates
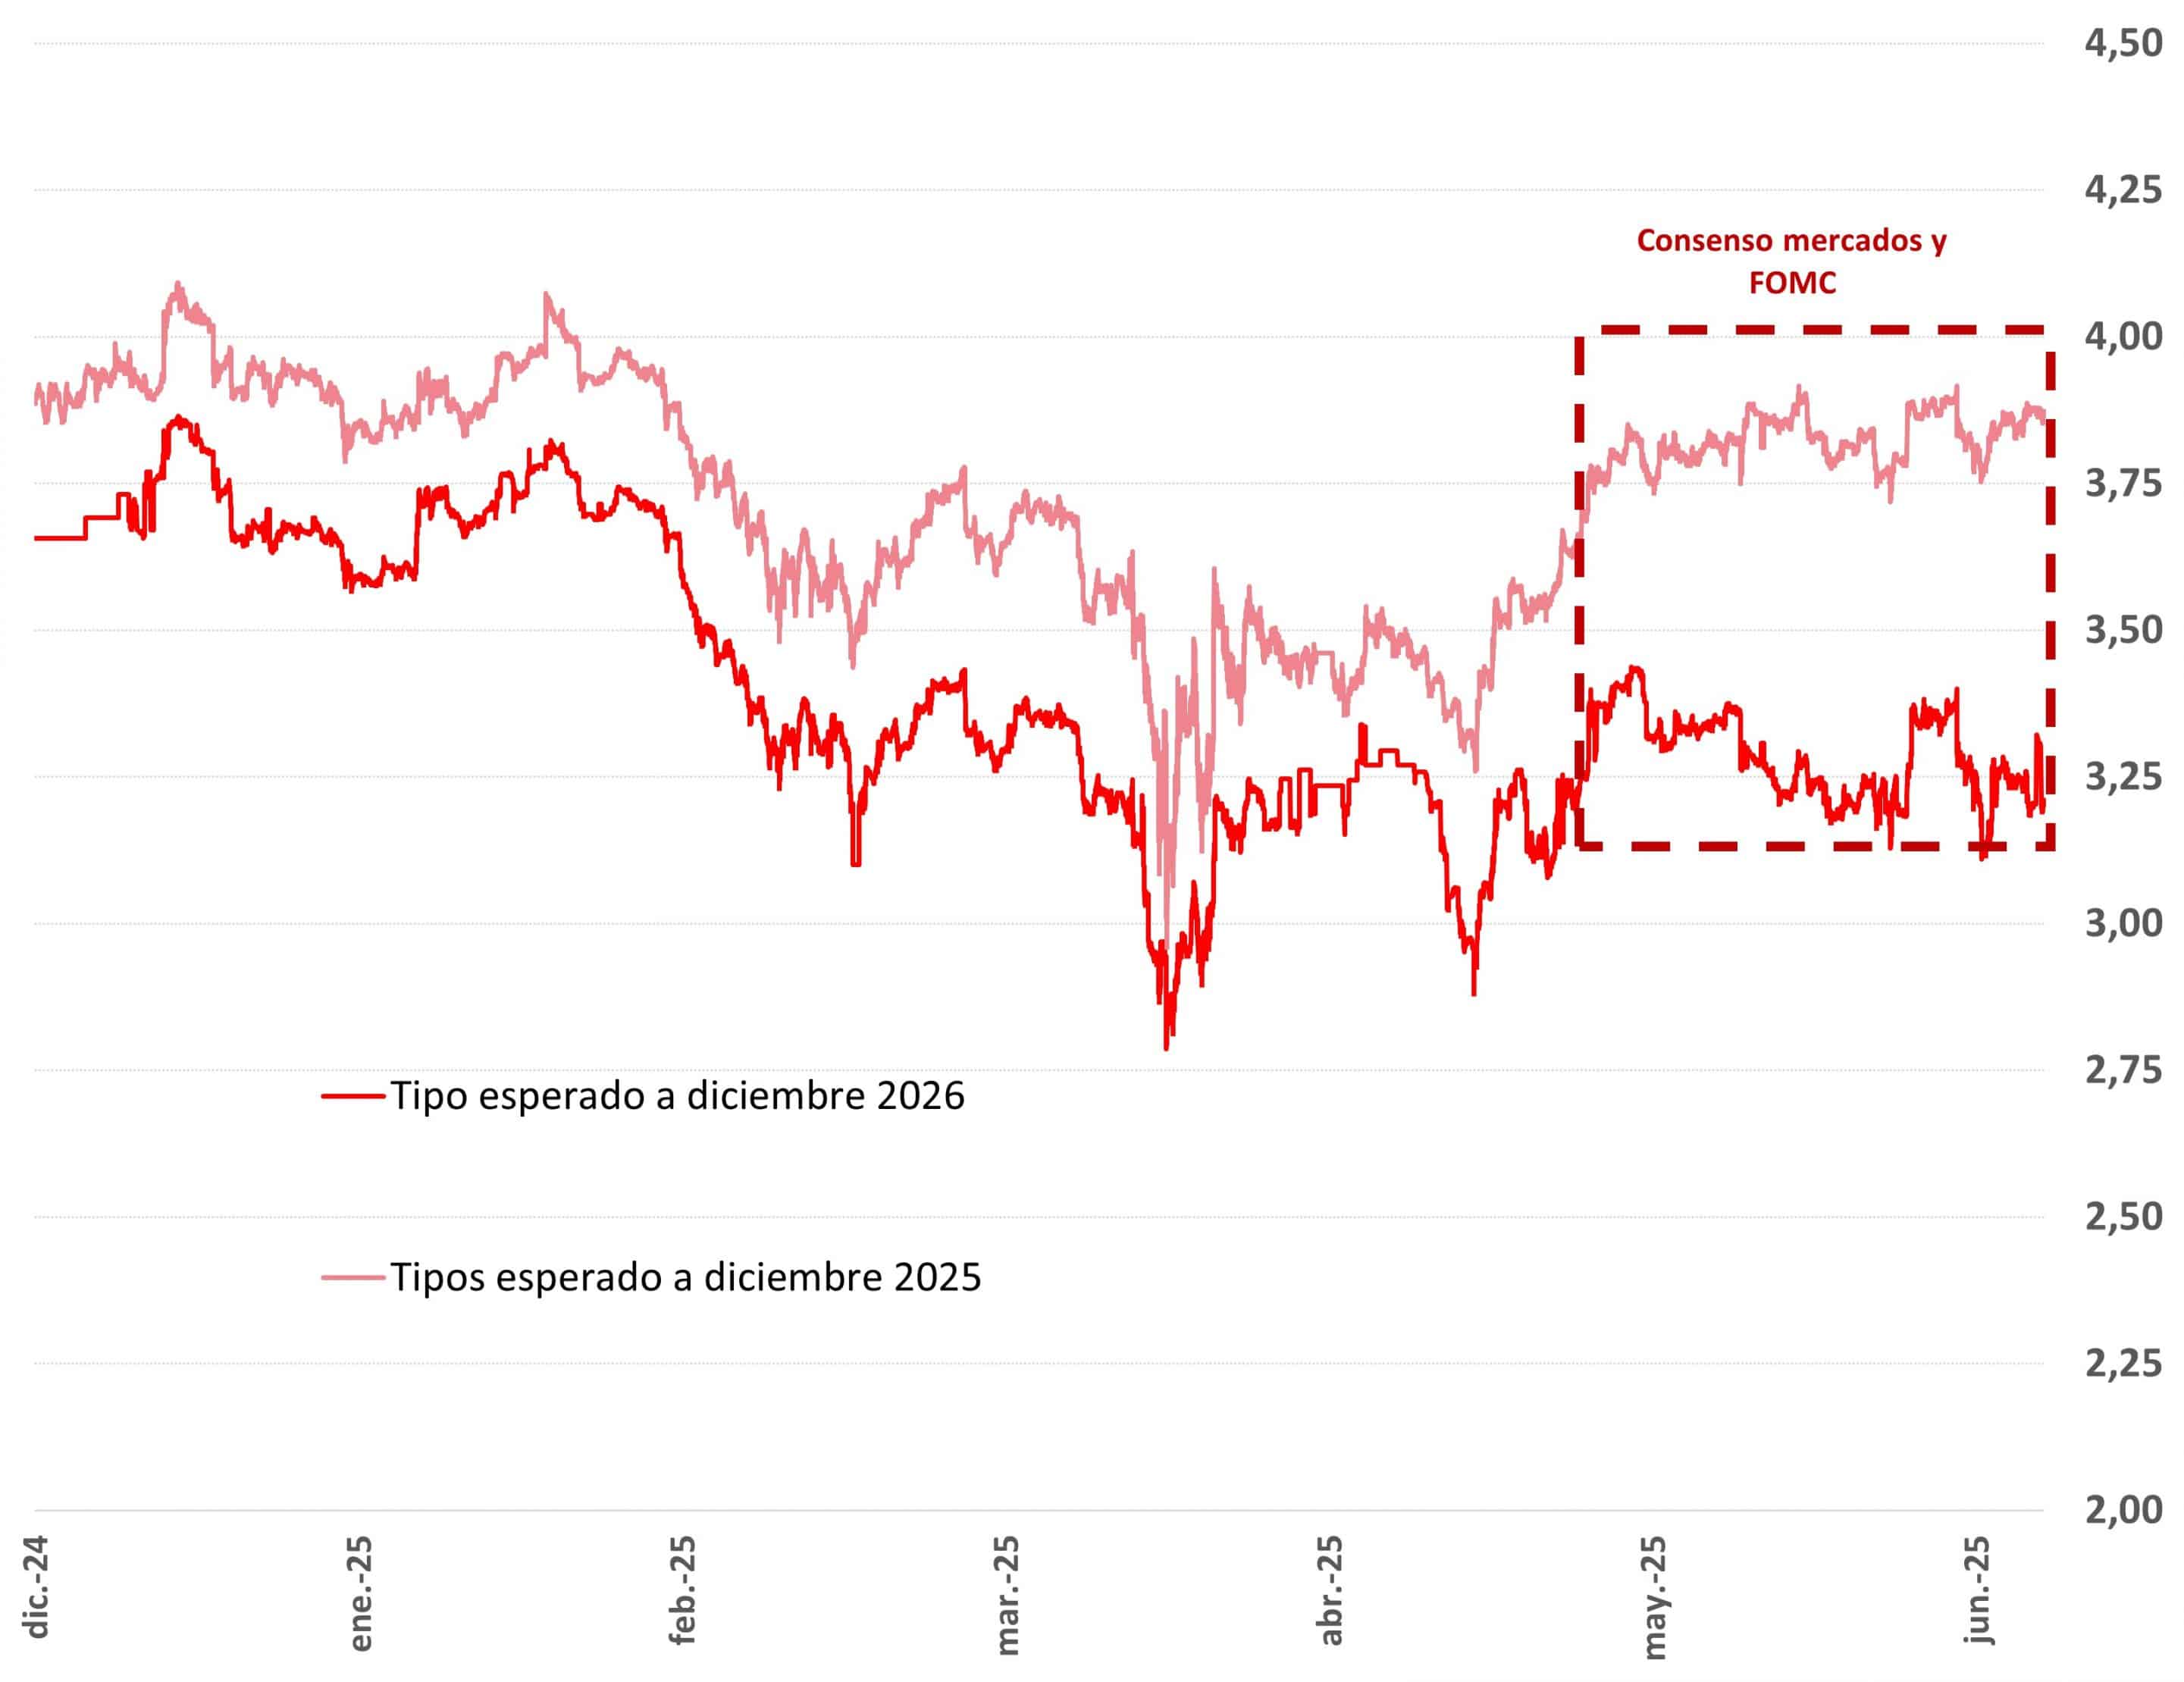
Source: MAPFRE Economics (based on Bloomberg data)