Is there a bubble in the stock market or not?

Redacción Mapfre
By Javier de Berenguer, analyst and fund selector at MAPFRE Inversión.
What the valuation metrics tell us…
Valuation multiples serve as a guide for the investment community to relate the amount of profit generated by a market or a specific company to its price. These ratios are very useful because they allow us to compare the market value of these companies not only over different periods of time, but also among the companies within the same industry sector.
So far, so good, but on their own, they are not a cure-all; it is important to know when to use them and how to interpret them.
Not all valuation multiples are a valid reference for every sector. Industries with higher growth potential often dedicate most of their capital to financing that growth, resulting in low profits (making the Price/Earnings [P/E] ratio invalid). In such cases, it is more appropriate to use multiples based on sales volume (e.g., Price/Sales). On the other hand, for more stable companies with mature businesses, the P/E ratio can be a good reference for valuing these companies. Similarly, for businesses with significant tangible book value—such as listed financial services or real estate—the P/E and P/B ratios are reliable benchmarks.
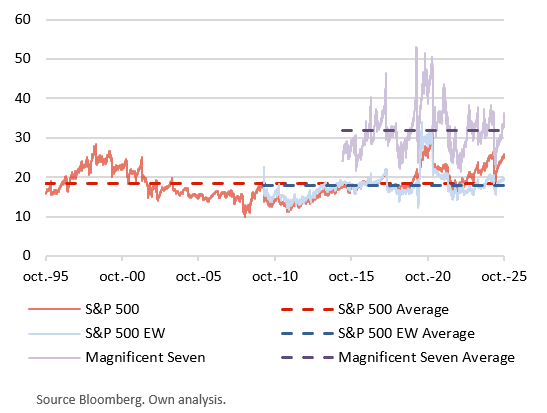
Once this is understood, let’s put the American market into numbers, which is currently the main focus of concern regarding valuation, and we will divide it into three groups: S&P 500, S&P 500 Equal-Weighted (EW), and the famous ‘Magnificent Seven.’
Forward P/E evolution (vs. historical average)
What the fundamentals tell us...
As we mentioned at the beginning of this note, these multiples are useful as long as we know how to use them, but above all, how to interpret them.
For this second point, it is crucial to understand whether the businesses that make up these indices have the same characteristics they historically had. Here, we introduce another variable: fundamentals (the operational health of the companies).
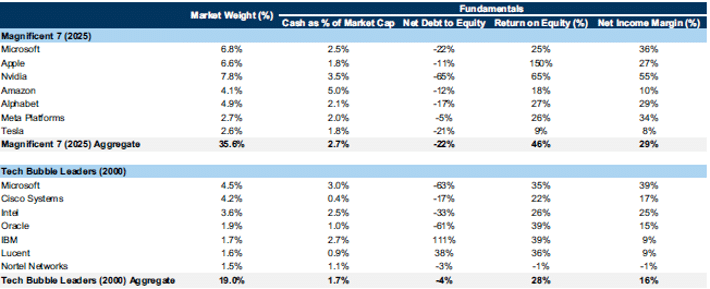
To complement the previous conclusions, the next chart brings two metrics into the discussion: ROE and Net Margin, which will indicate how profitable and sustainable the businesses behind these indices are.
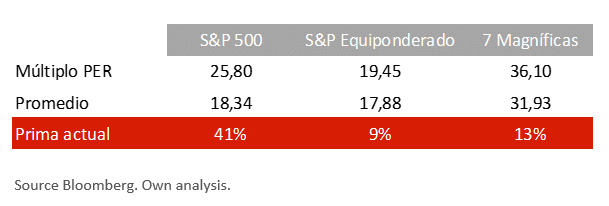
Observing the chart, we can draw a few conclusions. The first is that the data indeed indicate markets with somewhat elevated valuations: all three groups show P/E ratios above their 30-, 15-, and 10-year averages (depending on the starting point of the data). A second observation is that, although the market-cap-weighted index (S&P 500) deviates more from its average, the broader market (not just technology and the ‘Magnificent Seven’) also shows demanding valuation levels. We summarize it in the following table:
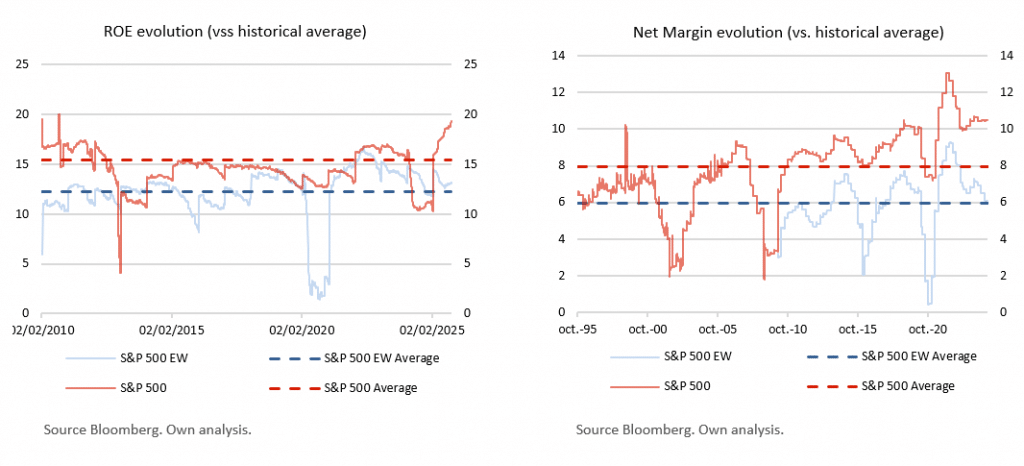
With this new data it is evident that the conclusions must change. Both ROE and margins are above their historical average and are expected to continue improving. Furthermore, it can also be concluded that the market-cap-weighted index shows much higher returns and margins than the broader market. To put it in numbers, for the S&P 500: ROE of 19% (+22% premium) and Margin of 11% (+42% premium); whereas for the broader market (S&P 500 EW): ROE of 13% (+7.37% premium) and Margin of 6.32% (+6% premium).
Therefore, based on these data, the index would be trading at a P/E premium of 41% over its historical average, but it also has ROE and Margin figures that are higher and roughly in line with that premium, which almost on their own could justify the valuation assigned by the market. However, it is worth remembering that, as mentioned earlier, the reliability of the multiple depends on the sector. So the question is: has the American market improved, or has its composition simply changed?
What the composition of the index tells us...
Reviewing what we have seen so far, we have a US market-cap-weighted index that has both increased its valuation and improved its fundamentals. On the other hand, the broader market is in a balance we could call ‘familiar,’ when relating the P/E ratio to business metrics. This gap in valuation and fundamentals between the two indices has widened particularly strongly in recent years and has become more pronounced with the emergence of artificial intelligence, which has supported the technology sector, while the rest of the market has struggled on multiple fronts: inflation, geopolitical tensions, supply chain disruptions, the trade war, etc.
Sectoral Evolution of the S&P 500 (since 1989)
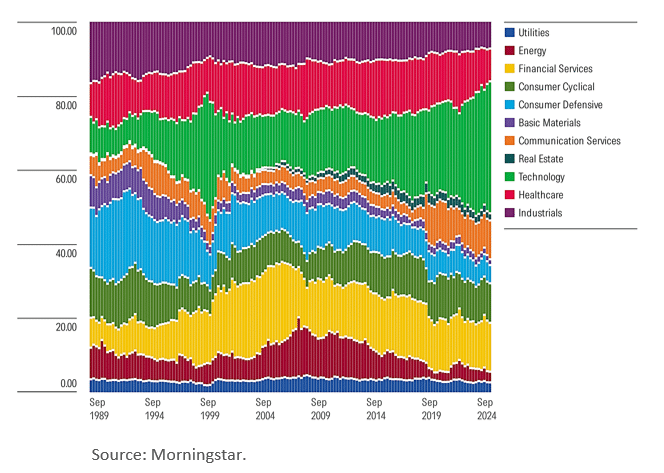
The chart clearly shows the evolution of the S&P 500 toward an index with a higher weighting in technology (from 10% in 1989 to 35% today) and communication services, and therefore with: lower physical capital, higher cash generation, greater innovation and scalability, among other characteristics that would justify a higher valuation multiple for the current index. Once we have examined the peculiarities of the American market, let us now move on to analyzing the comparison between the US stock market and the rest of the world.
But when compared the rest of the international stock markets—is it expensive or cheap? And compared to other historical bubbles?
Contrary to what one might think, there are currently few safe havens in terms of indices or aggregated markets, even when the focus of analysis is outside the United States.
Global Index Valuations
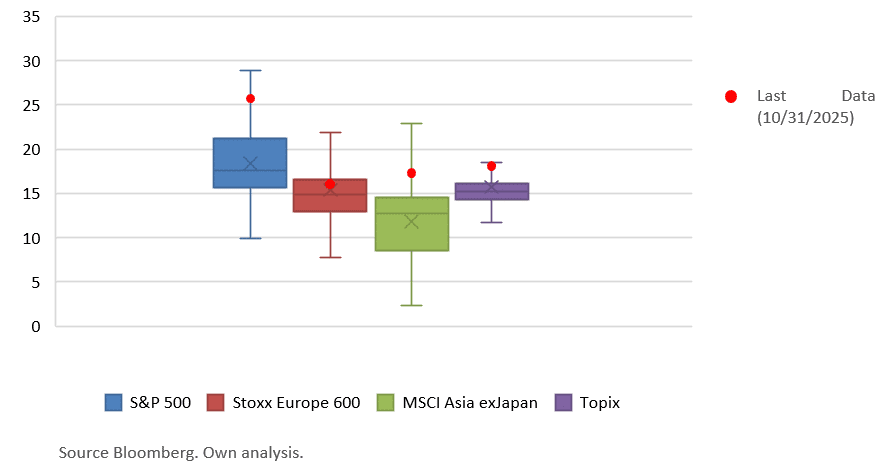
Based on the data, we can say that current valuations are somewhat demanding, but we cannot claim that we are in a bubble—at least not yet. To complement the analysis and the reasons discussed, we will show in a table some of the valuation and business figures of the key players in past market bubbles.
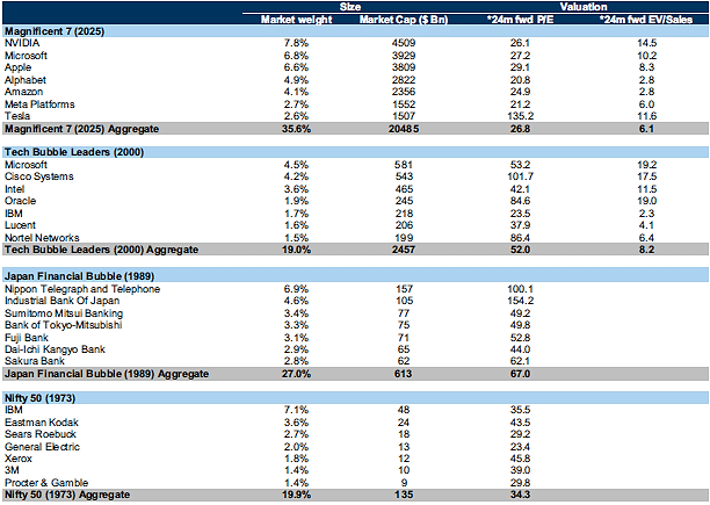
Source: Goldman Sachs.
The table clearly shows that the valuations of these large companies in the index are far from levels of the previous bubble. Perhaps the ‘risk’ here comes from concentration: on one hand, within the index itself (the percentage these seven companies represent of the total), and on the other, from the concentration of retail investors in passive products (i.e., those that replicate the index) leaving them highly exposed if this group of companies fails to meet the expectations reflected in their stock prices.
To conclude this section, we complement the analysis with another table from Goldman Sachs, this time focusing on the comparison most often cited in the media (the dot-com bubble) and the business metrics of the companies involved.
Source: Goldman Sachs.
But be careful, because there are always risks!
Given everything we’ve seen, we can draw both ‘bad’ and ‘good’ news from the points presented in this note. Starting with the positive, we are NOT in a bubble, and the evolution of the indices currently depends on continued growth in earnings and other metrics (ROE, margins) supporting the stock prices. On the negative side, there is NO valuation buffer: the market is somewhat expensive, and there’s no shame in saying it. However, there are factors that could continue to support the markets: a broader group of winners (more companies contributing to the index’s final return), efficiency improvements brought by artificial intelligence, or the start of a new earnings growth cycle in industries that have lagged behind. On the other hand, there are also macro variables that appear to provide support: abundant liquidity, stable economic growth, increased backing from monetary policy, and the implementation of substantial public investment commitments (defense, AI, digitalization, energy, etc.). Another negative point, as we have already mentioned, is concentration: the lack of a valuation buffer and a highly concentrated market pushes us to increase diversification in portfolios, making it a key tool in managing these risks.
Regarding artificial intelligence, we must be attentive to what happens around its development, as this matter will determine whether we end up in a bubble or not. We are currently only two years into the race to master this new technology. One could say there is still a long way to go in terms of the volume of investment required and the number of participants that will join. The fact that it is a transformative technology attracting significant capital is precisely why we must monitor its development closely, as these have been characteristics that also appeared in other markets that eventually ended in a bubble. Here we list some of the common characteristics that tend to appear in these markets:
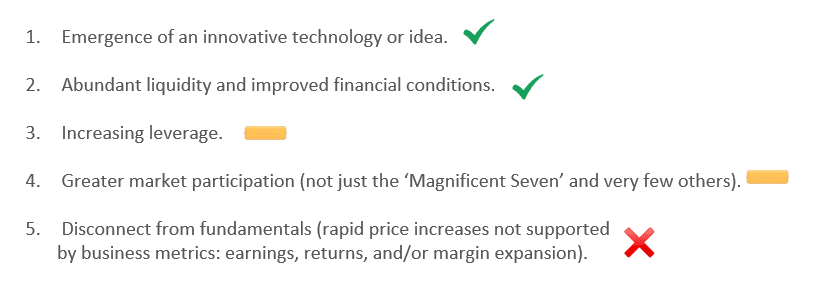
The first two characteristics are those we believe are already present among us. The third and fourth are still occurring at relatively small volumes, but we are beginning to see increases in both. Regarding the fifth, as we have explained throughout this note, we consider that, so far, stock prices have been justified by improvements in fundamentals. Moreover, this disconnect typically occurs at the end of bull markets, serving as the final signal that a bubble is forming.
To conclude, it should be noted that from now on we need to pay closer attention to factors 3 and 4, that is, to observe how the development of AI is financed and how it increases the volume of participants. So far, hyper-scalers (megatech) have been financing this development with cash flow, but we already have news that this is changing (Alphabet and Meta have recently announced bond issues worth several trillions of dollars to finance AI). On the other hand, the concentration of technology among a few American companies is also decreasing ; we are already seeing how other players within the semiconductor value chain are joining this wave of investments, also at a global level, especially in China where many efforts are being made to build a powerful ecosystem around it.