Contrasting monetary policy decisions: ECB holds interest rates steady while Fed cuts them by 0.25 percentage points

Redacción Mapfre
The European Central Bank (ECB) and the US Federal Reserve (Fed) held their September meetings and reached different decisions: while the ECB decided to keep interest rates unchanged, the Fed cut them by 0.25 points. Eduardo García Castro, expert economist at MAPFRE Economics, provides an in-depth analysis of both meetings.
European Central Bank (ECB)
At its September meeting, the European Central Bank (ECB) left interest rates unchanged, holding the marginal lending rate at 2.40%, the main refinancing rate at 2.15%, and the deposit facility at 2.00%. On the balance sheet, no further guidance was offered, although the ECB stressed its ability to counter unjustified and disorderly market dynamics that could threaten monetary policy transmission in the Eurozone countries.
At the macroeconomic level, new forecasts were presented, albeit similar to those published last June. In terms of GDP, the figures were revised upward for 2025, with estimates of 1.2%, but trimmed for 2026 to 1.0% (com-pared to 1.1% previously) and left unchanged for 2027 (1.3%). Regarding inflation, the fore-casts were nudged up to 2.1%, 1.7%, and 1.9% for those three years (compared to 2.0%, 1.6%, and 2.0% previously).
While there were no major surprises, the outlook suggests that the bar for additional rate cuts has now been raised. With this in mind, more compelling evidence will be needed for these cuts to materialize. However, renewed tensions in debt markets (as highlighted in our recent report Economic and Industry Outlook 2025: Perspectives for the Second Half) could require some support from the ECB should these movements intensify or spread to other Eurozone members, particularly those facing greater fiscal challenges.
Assessment
Since the ECB's July meeting, clearer signs have emerged on the trade front, most notably the absence of retaliatory measures. This factor has reduced uncertainty, although the full impact of tariffs has yet to be seen. Economic momentum has remained moderate, but positive, and inflation continues to hover around the ECB's target. This dynamic strengthens the narrative that the balance of risks is now more even, supporting the decision to keep monetary policy unchanged. Furthermore, despite the recent volatility in the debt markets, the activation of extraordinary measures still seems distant, unless there is a substantial, unjustifiable widening of spreads. With this in mind, although the economy could accommodate a further rate cut toward the lower end of the neutral range (1.75%–2.25%), there appears to be no immediate need for such a move.
In terms of economic activity, second-quarter GDP improved 0.1% QoQ, supported by both public and private consumption. Net trade and fixed investment figures dragged on growth (returning to normal compared to the previous quarter and influenced by tariff-related volatility). Regarding other high-frequency data, the indicator fell 0.5% in August, to 95.2 points, while the PMIs showed marginal improvements. This was partly driven by the services sector, which, although still expanding, continues to lose momentum, and by a manufacturing sector still in the recovery phase. Taken together, these factors suggest that growth will remain moderate in the future (see Charts 1 and 2).
Chart 1: Eurozone GDP by components
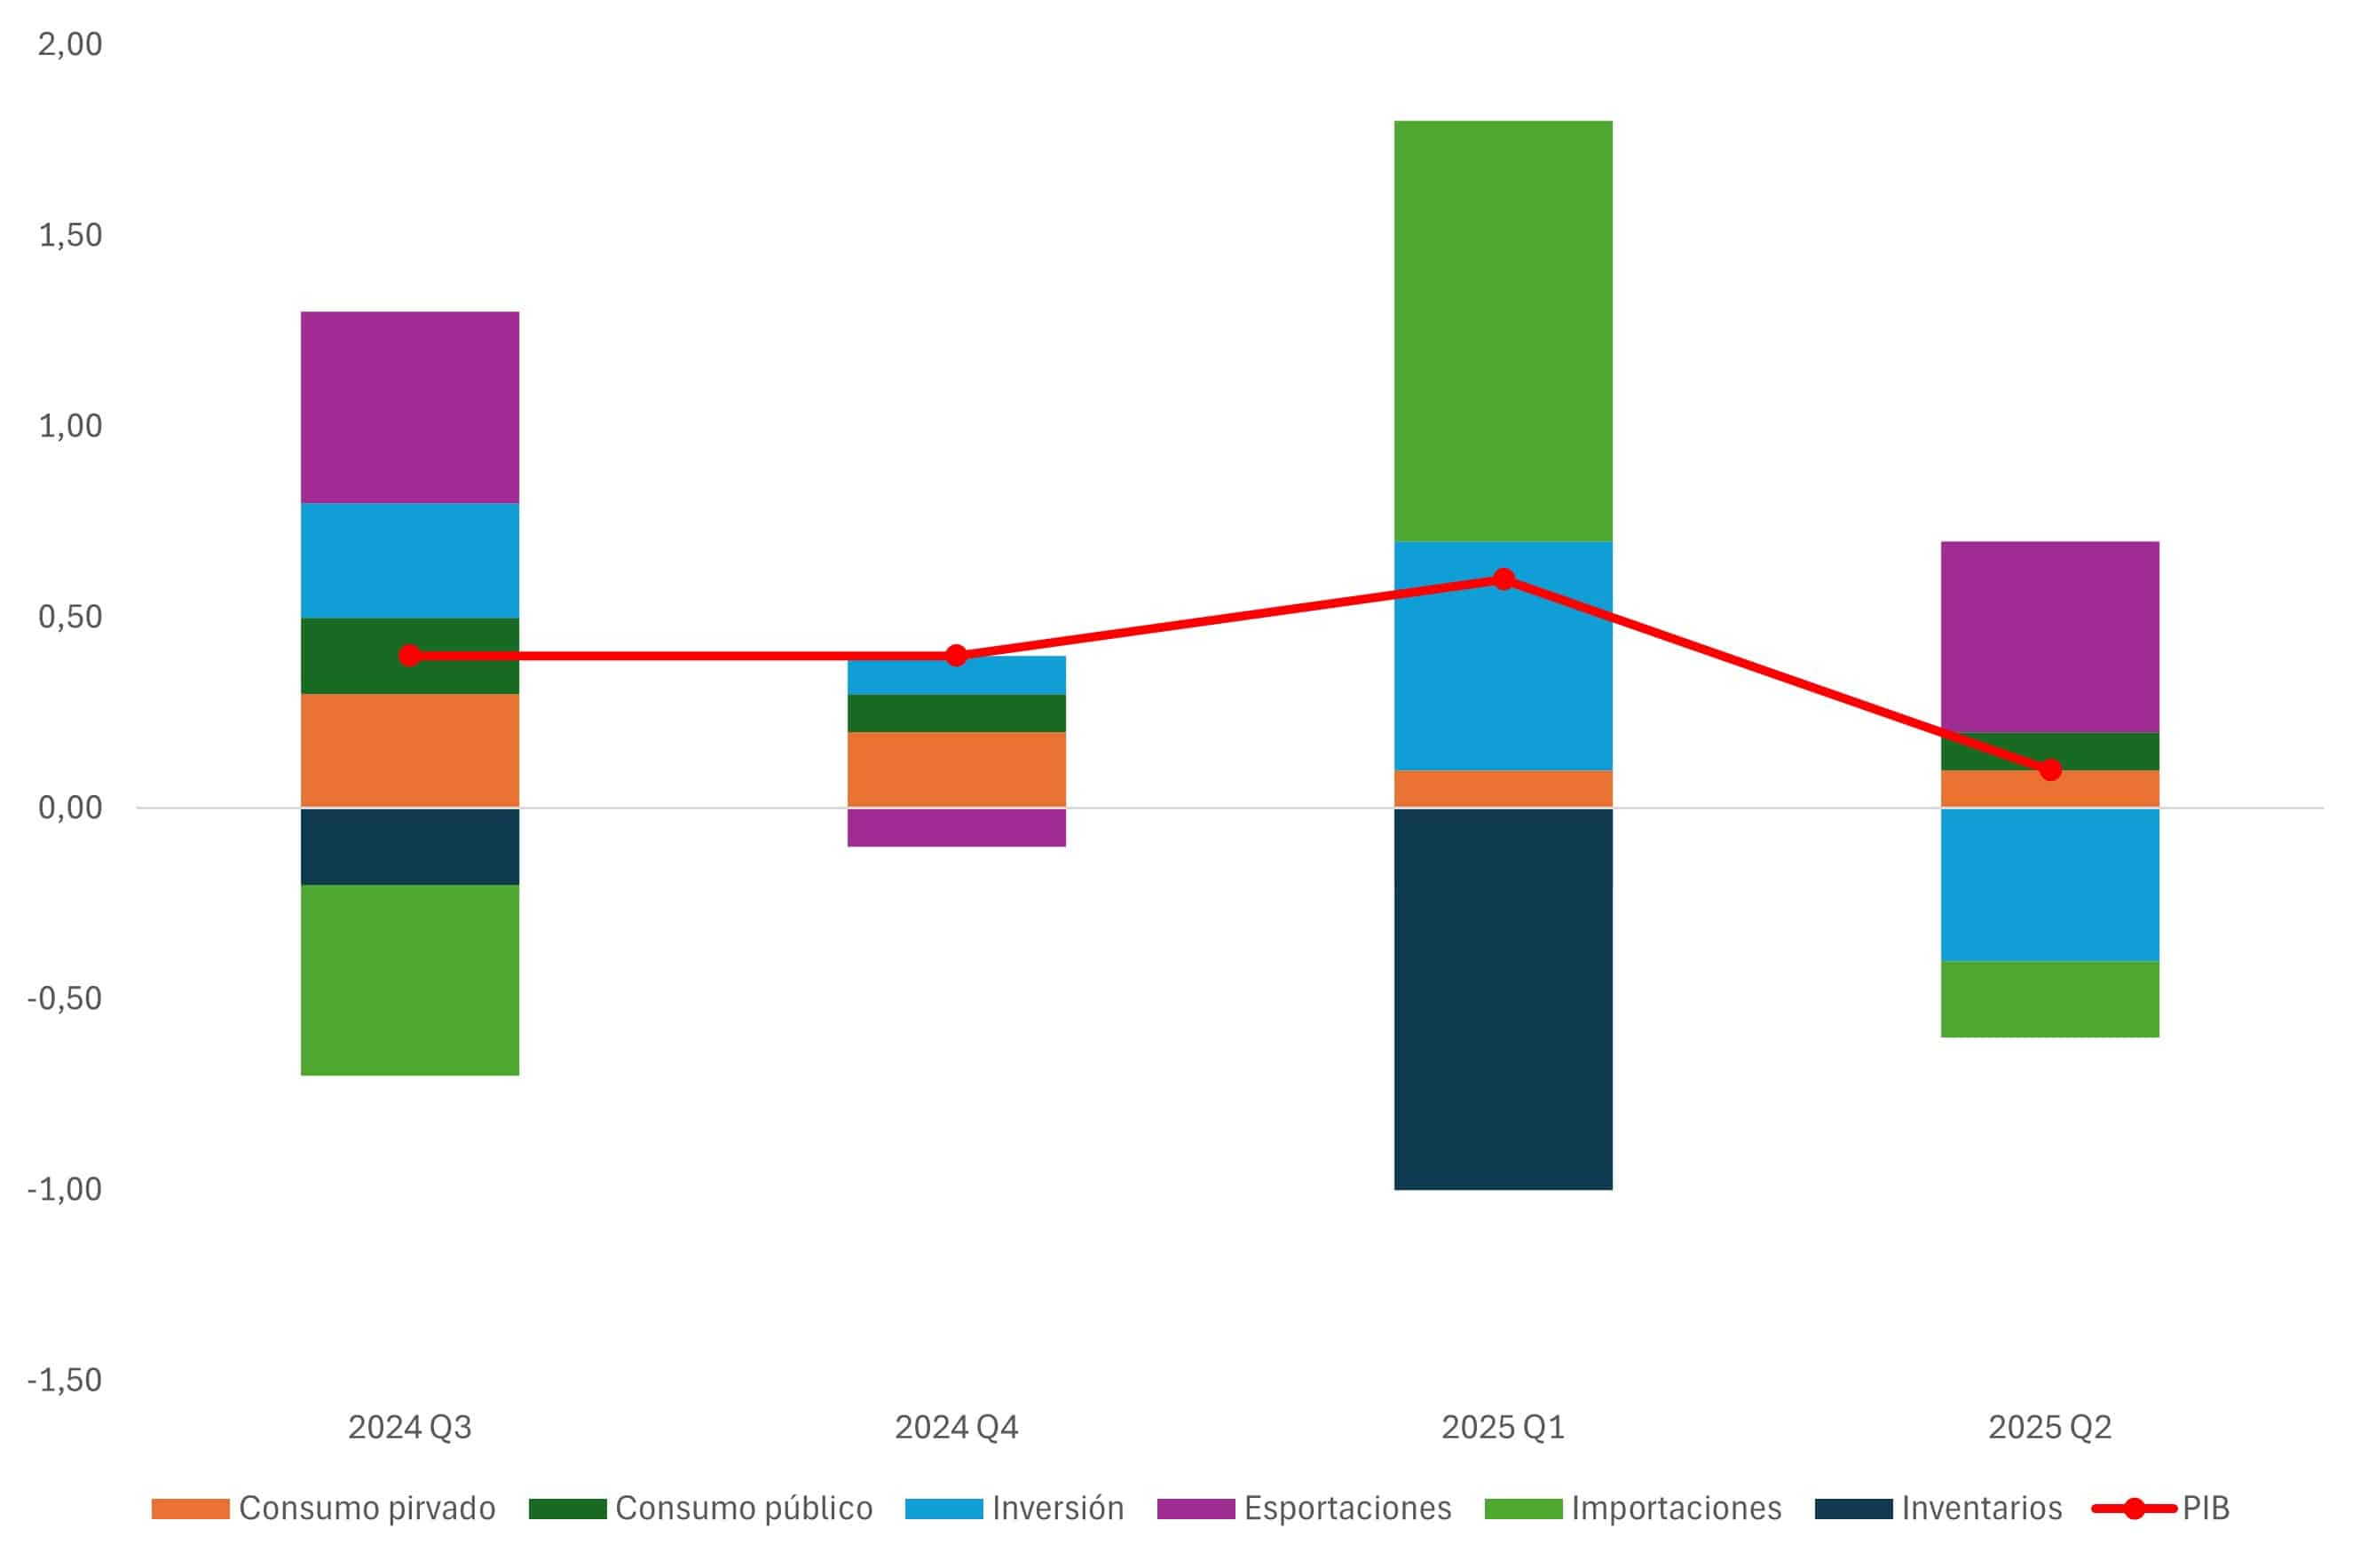
Source: MAPFRE Economics (with Haver data)
Chart 2: PMIs in the Eurozone
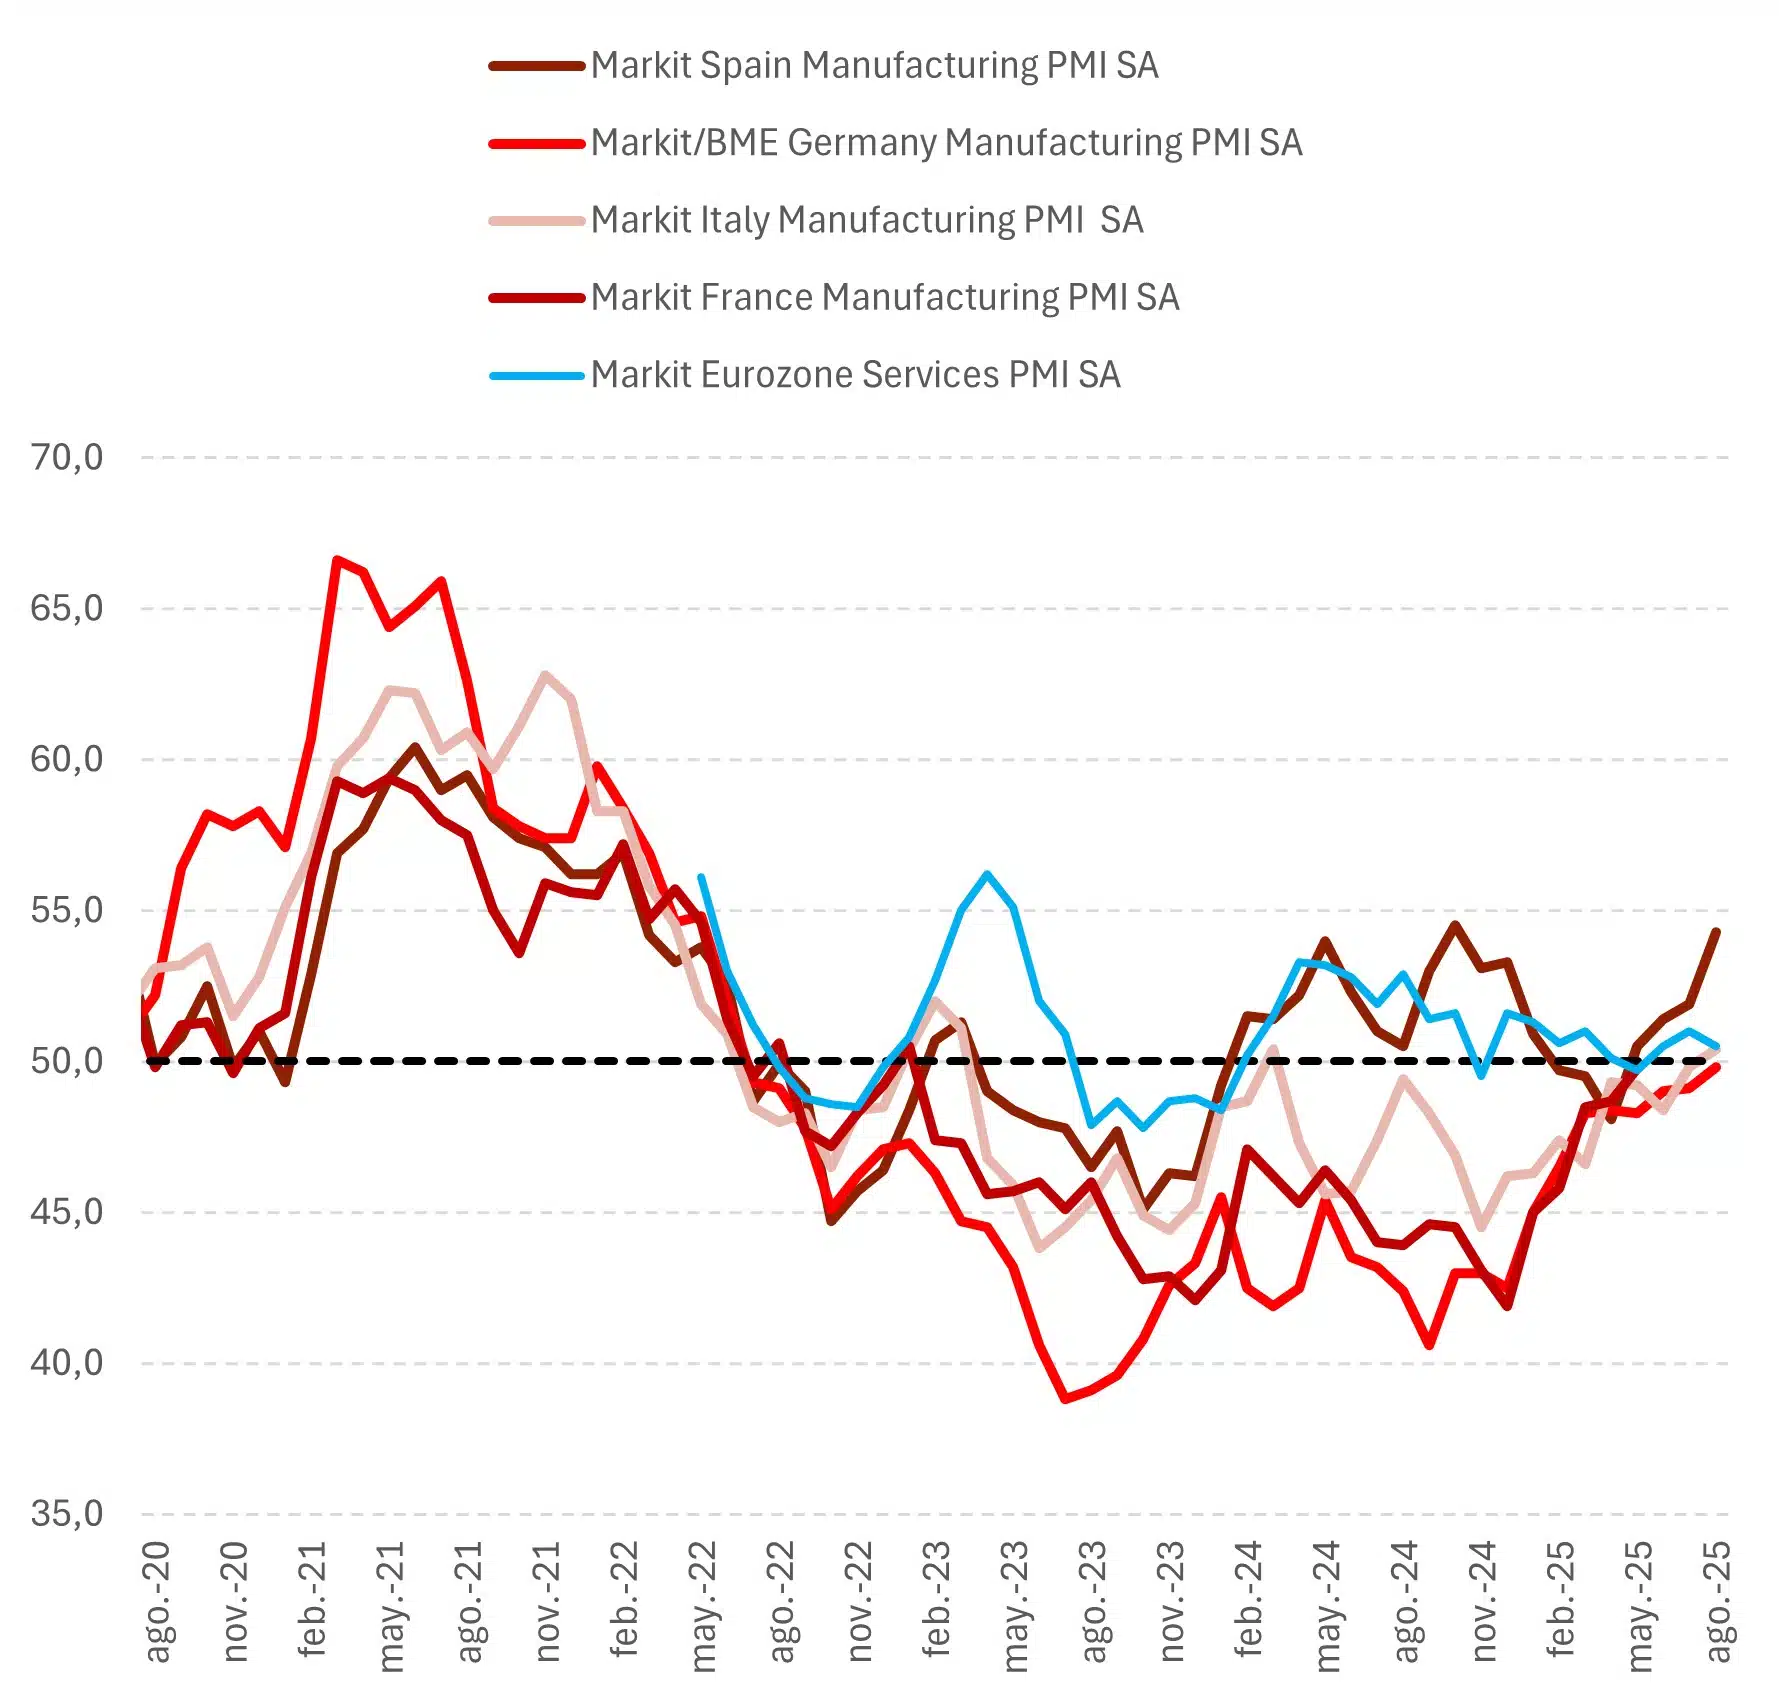
Source: MAPFRE Economics (based on Bloomberg data)
Eurozone inflation (see Chart 3) edged higher in August, rising to 2.1% year-on-year (from 2.0%), while the core rate remained the same at 2.3%. Services inflation continued its downward trend, while the goods component re-mained stable. Combined with a further increase in energy prices (still negative in annual terms), this suggests there will be no significant changes in the short-term inflation outlook.
Chart 3: Main CPI metrics in the Eurozone
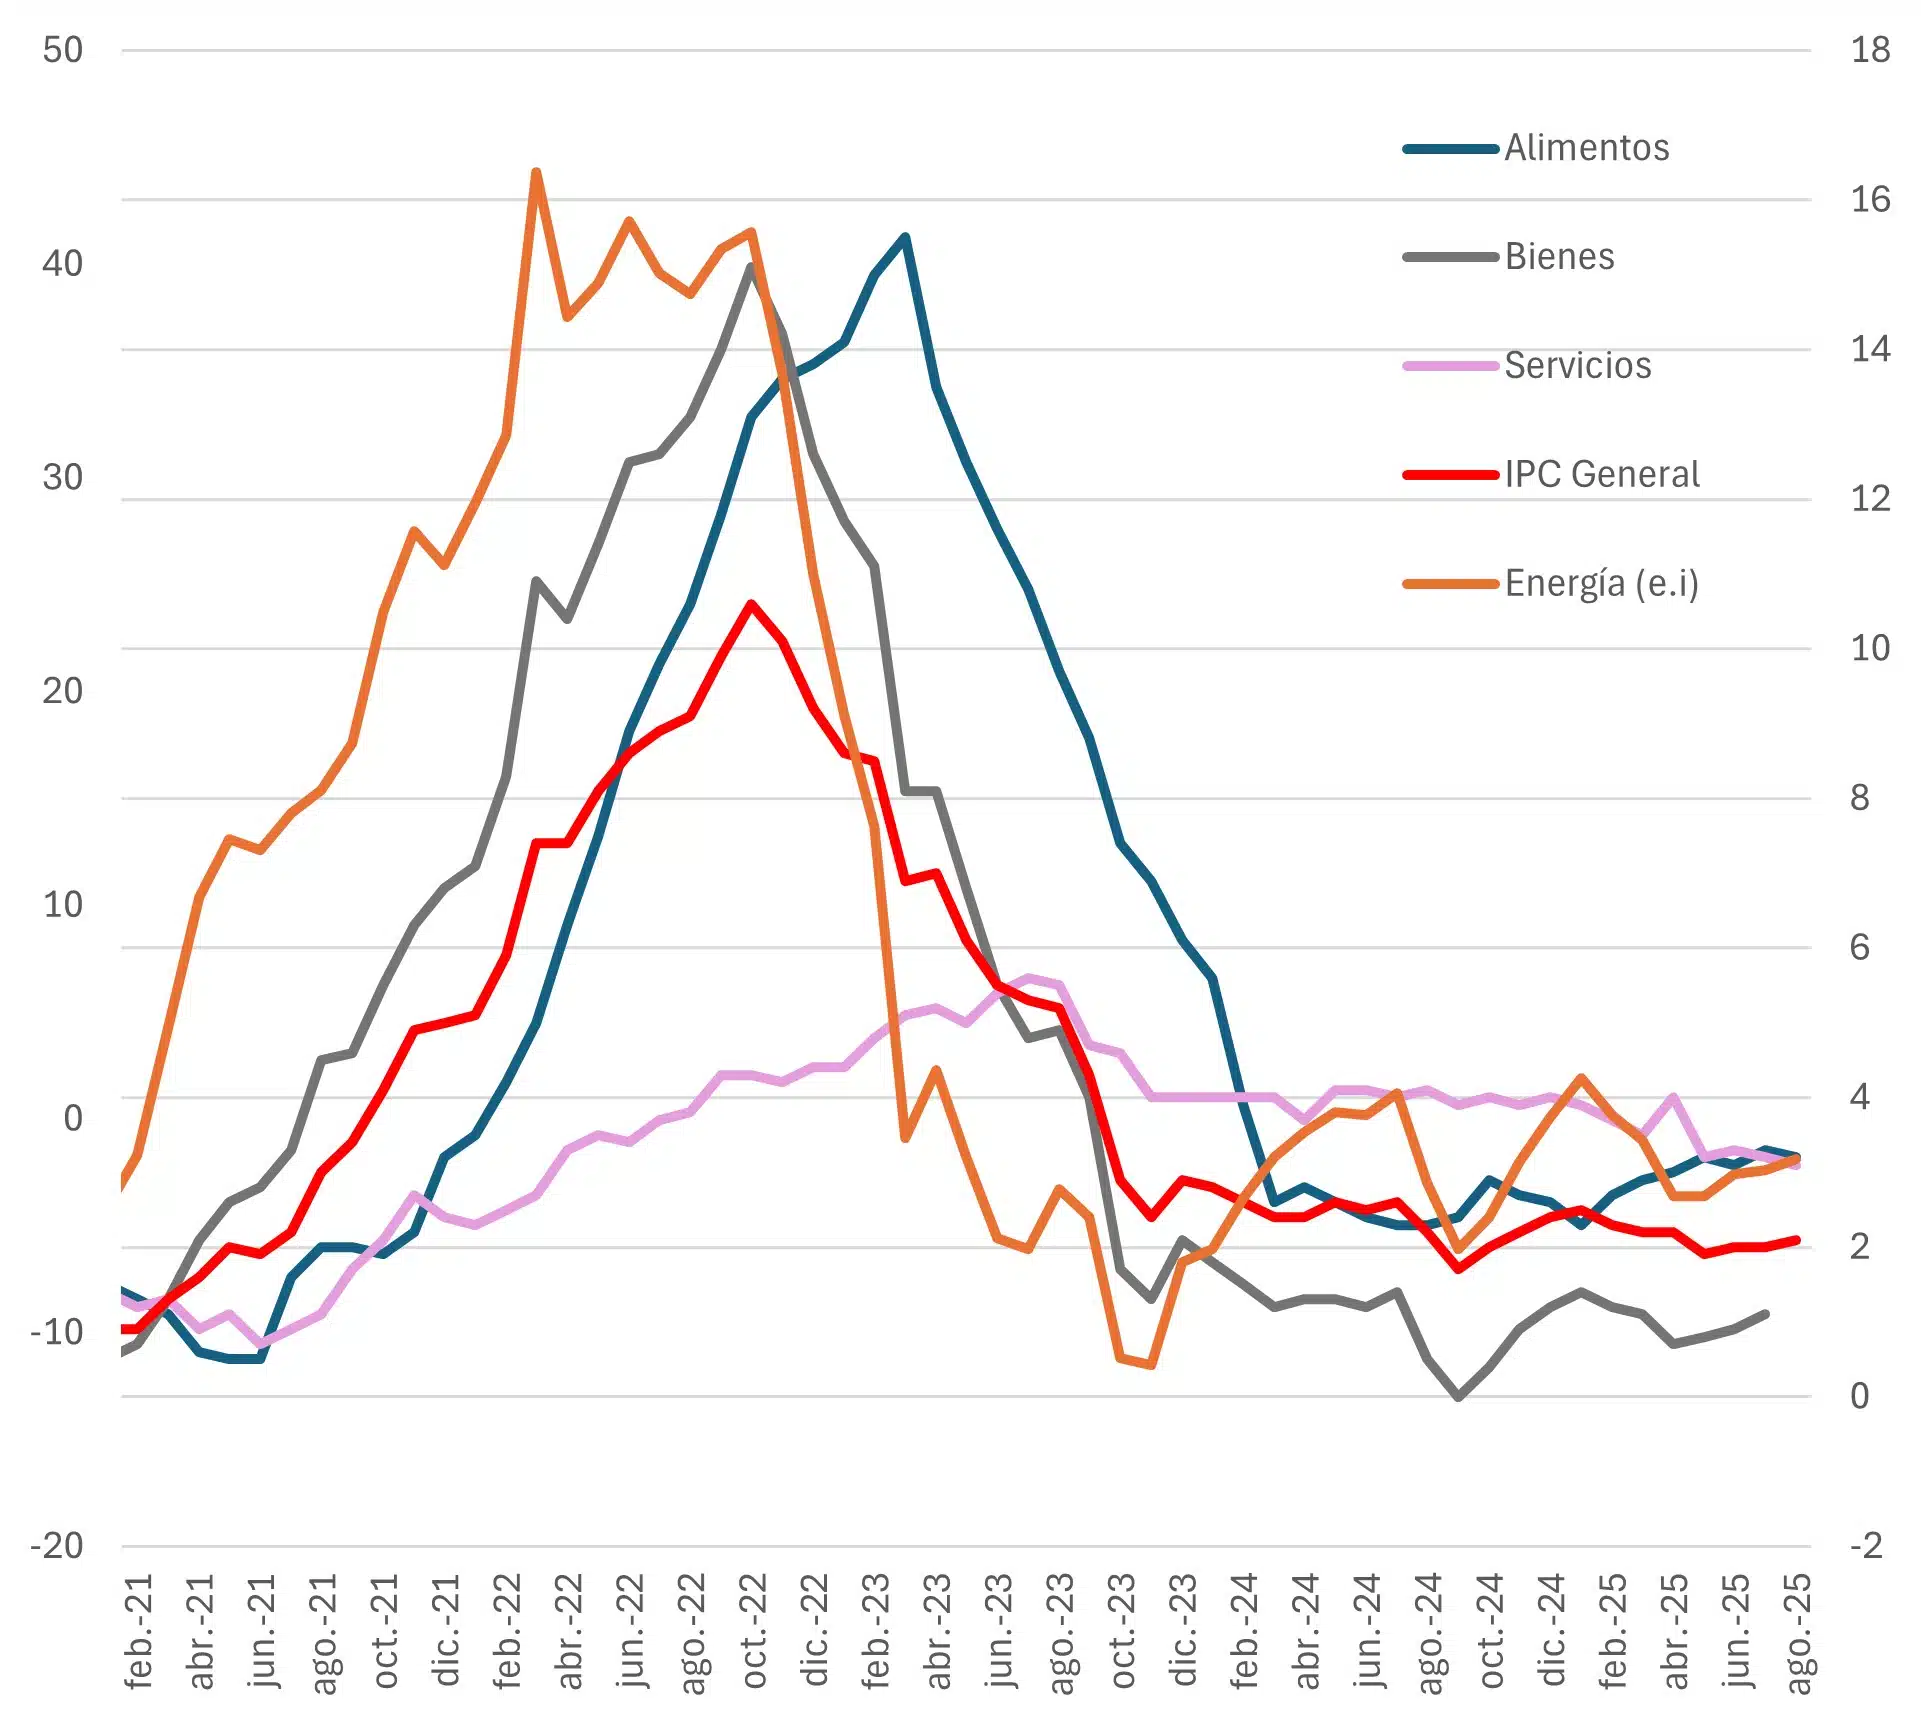
Source: MAPFRE Economics (with Haver data)
In terms of risks, and once the new tariff framework with the United States has been established, concerns will focus on the rise in bond yields—particularly developments in France, where the risk spread has matched that of Italy on the 10-year horizon (see Chart 4).
Chart 4: Difference in percentage points between France and Italy over 10 years
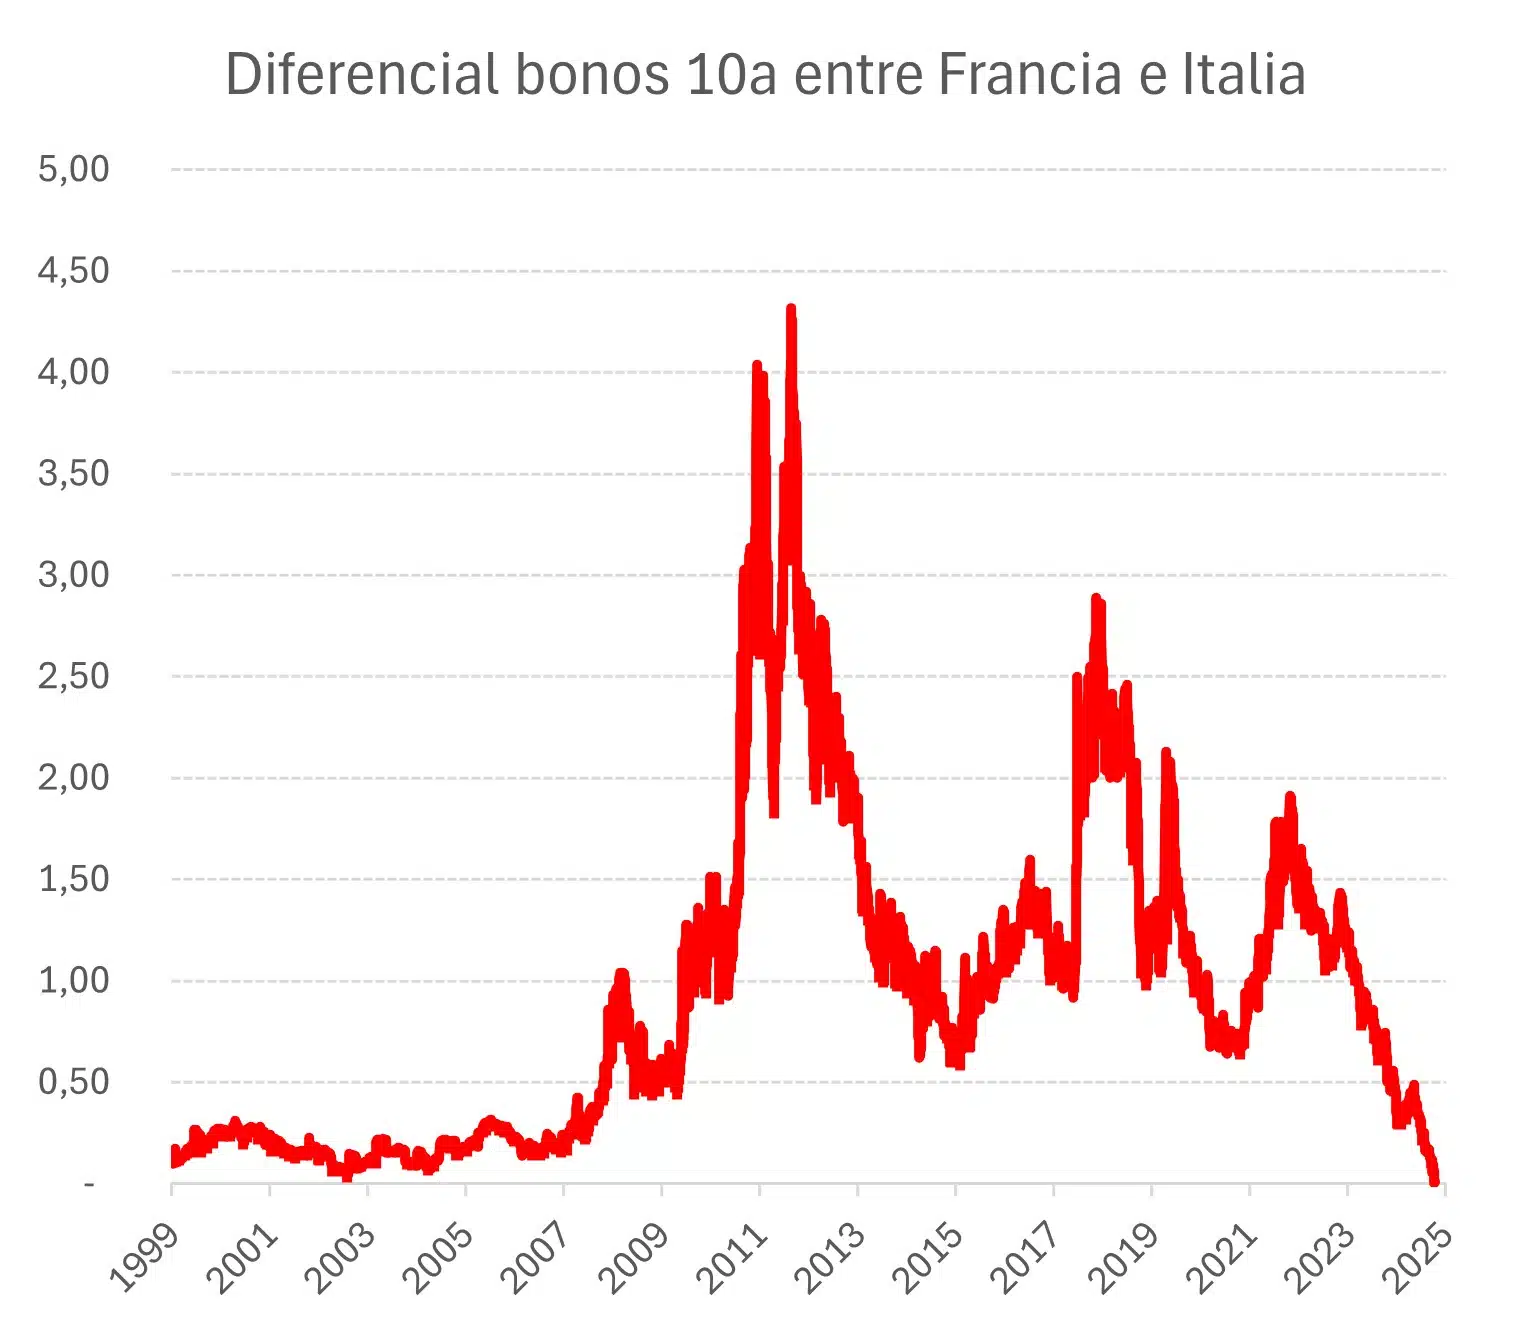
Source: MAPFRE Economics (based on Bloomberg data)
While this can be attributed to country-specific factors rather than changes in fundamentals, there is concern about broader contagion, which would expose the dilemma of whether to trigger the Transmission Protection Instrument (TPI). At this stage, that remains an unlikely scenario, although a review of the debt rating in the coming months cannot be ruled out. If that were to happen, the main drawback is that the TPI is designed to counteract deteriorations in financing conditions not justified by fundamentals; this requirement does not seem obvious in France’s case.
While there have been a number of developments since June—a clearer trade outlook, a stronger currency, and a growth-inflation balance with no major changes—none have prompted the ECB to deviate from its plans, with future decisions hinging on new data. In the short term, both the tone and the policy rate are expected to remain neutral. Looking further ahead, the bar for another interest rate cut will remain high, as current market expectations indicate. Over a longer horizon, and without compromising price stability (the ECB's sole mandate), priority could be given to a secondary objective: boosting economic activity, which would only be justifiable should it fall to levels below its potential (see Charts 5 and 6).
Chart 5: SWAP-discounted interest rates
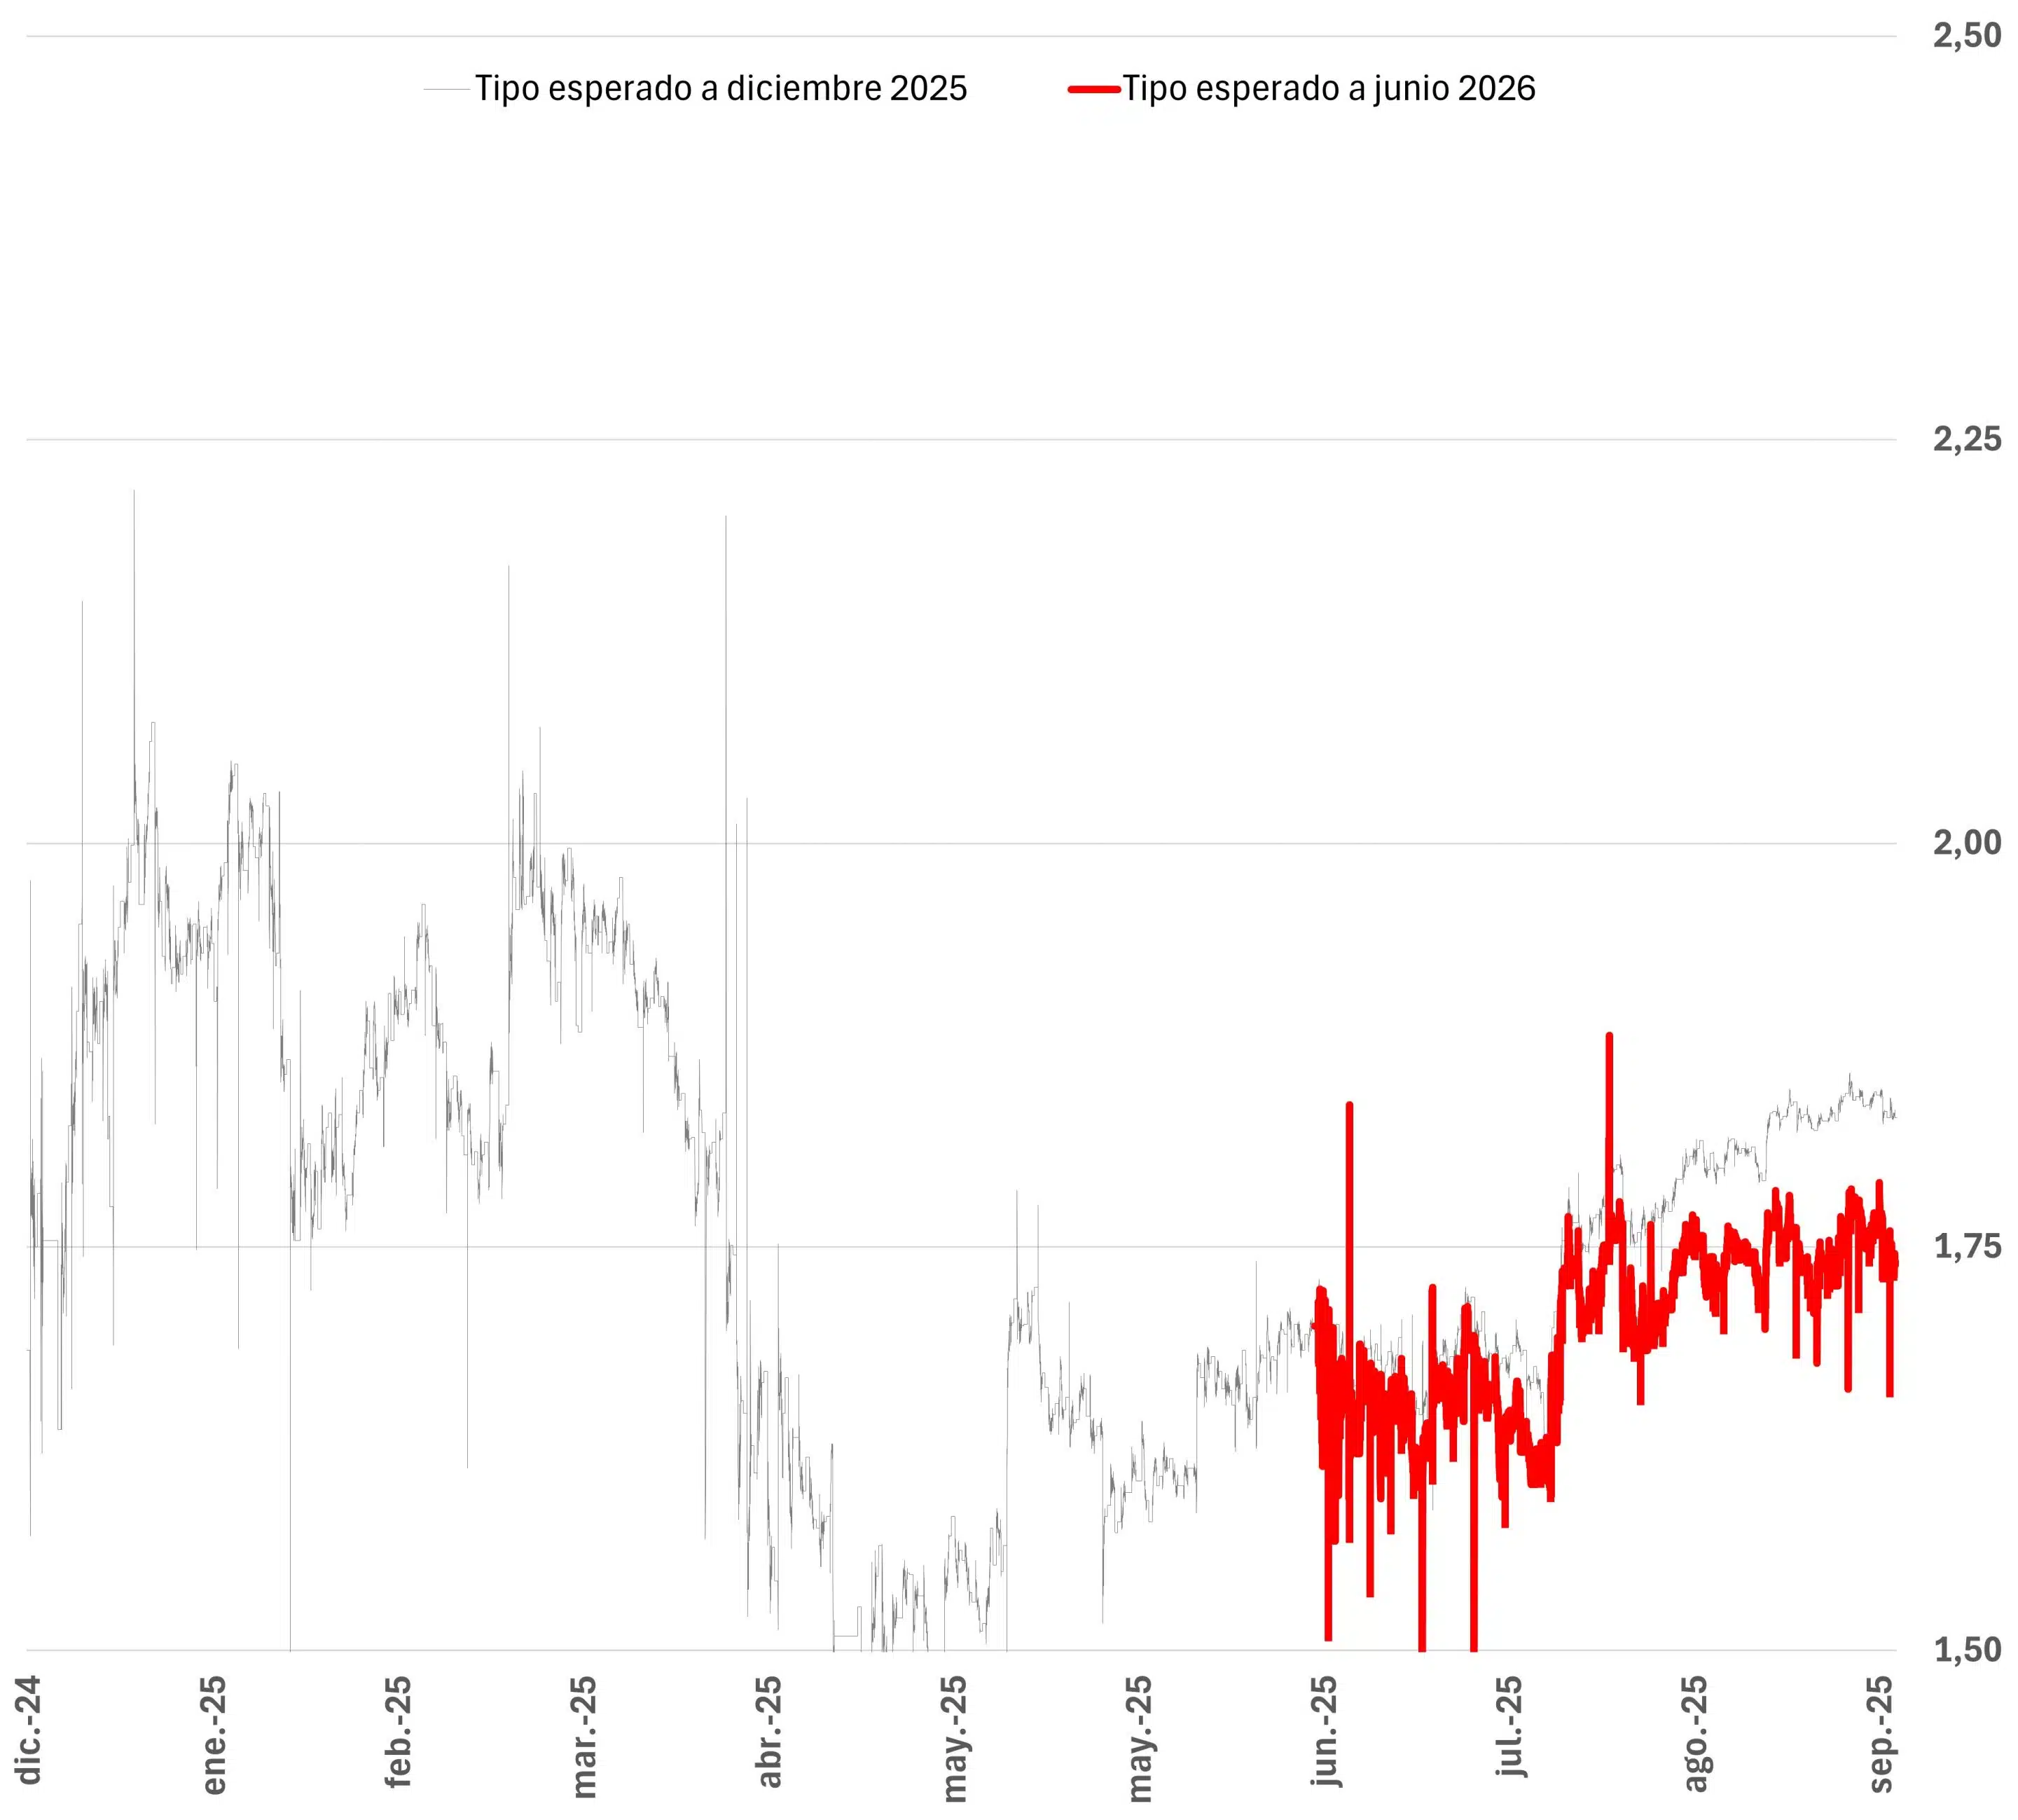
Source: MAPFRE Economics (based on Bloomberg data)
Chart 6: Interest rates projected by MAPFRE Economics
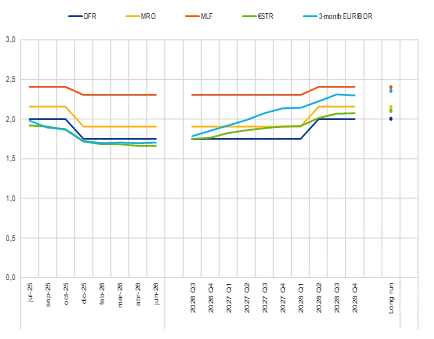
Source: MAPFRE Economics
Federal Reserve (Fed)
The U.S. Federal Reserve resumed its easing cycle, cutting the benchmark interest rate by 25 basis points (bps) to a target range of 4.00%–4.25%, with greater consensus among Federal Open Market Committee (FOMC) members compared with the June decision. Regarding the balance sheet, no changes were announced, so the pace of quantitative tighten-ing (QT) will continue as planned, with 5 billion dollars in sales.
Alongside the policy decision, the Fed released its updated dot plot, which points to an addi-tional 50 bps of cuts in 2025 (one more reduction), followed by 25 bps each in 2026 and 2027. The long-term rate projection remains elevated, around 3% (see Chart 1).
Chart 1: Dot Plot
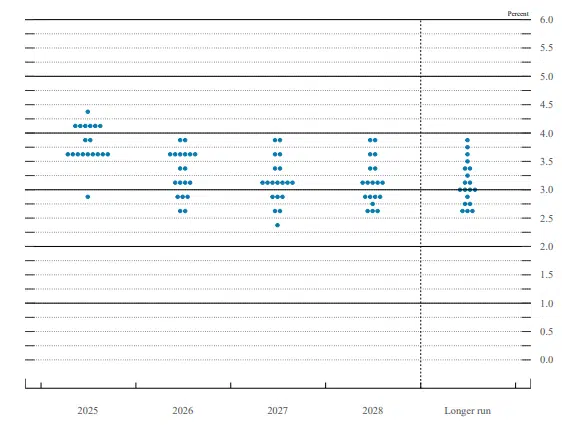
Source: MAPFRE Economics (based on Federal Reserve data)
The Federal Reserve also released an updated set of macroeconomic projections, showing stronger growth prospects but slightly higher inflation. Specifically, the Fed revised its economic growth forecasts upward to 1.6% for 2025 and 1.8% for 2026 (vs. 1.5% and 1.6% previously), while inflation is now projected at 3.0% and 2.6%, respectively (vs. 3.0% and 2.4% in June). Over the long term, growth is forecast at 1.8% (slightly below potential) and inflation at 2.0%, suggesting that inflation will not return to target until after 2027.
At the subsequent press conference, the Fed justified its shift toward a more neutral stance by citing increased downside risks to the labor market. Even so, the overall tone conveyed a clearer pivot than at the previous meeting, toward a more moderate policy outlook. Specifically, despite some contradictory signals in the macroeconomic forecasts—with certain stagflation undertones—the decision under-scores that, from a risk-management standpoint, growth and employment now take prec-edence, even though inflation appears likely to take longer to return to target. Indeed, while a near-term rebound in inflation is considered likely, the new risk balance reinforces the view that the shifting labor-market landscape makes a wage–price spiral less probable going forward. All of this is set against a backdrop where tariffs and trade tensions remain part of the equation, although the level of uncertainty has diminished (see Chart 2).
Chart 2: Trade uncertainty
Source: MAPFRE Economics (based on EPU data)
Assessment
After a largely uneventful first half of 2025, the FOMC decided in September to cut rates and adopt a more moderate stance, at a time when the Federal Reserve’s independence has been in the spotlight. With economic activity forecasts still showing resilience, inflation proving stubborn, and no visible effects yet from tariffs (given the lag between announcements and their impact due to inventory accumulation), the policy decision was driven almost entirely by signs of labor-market weakness. In this way, it reiterates the message from Jackson Hole in August: the balance of risks has shifted. Still, by acknowledging that inflation risks are skewed to the upside while employment risks are skewed to the downside, the Fed effectively intensified the stagflation narrative.
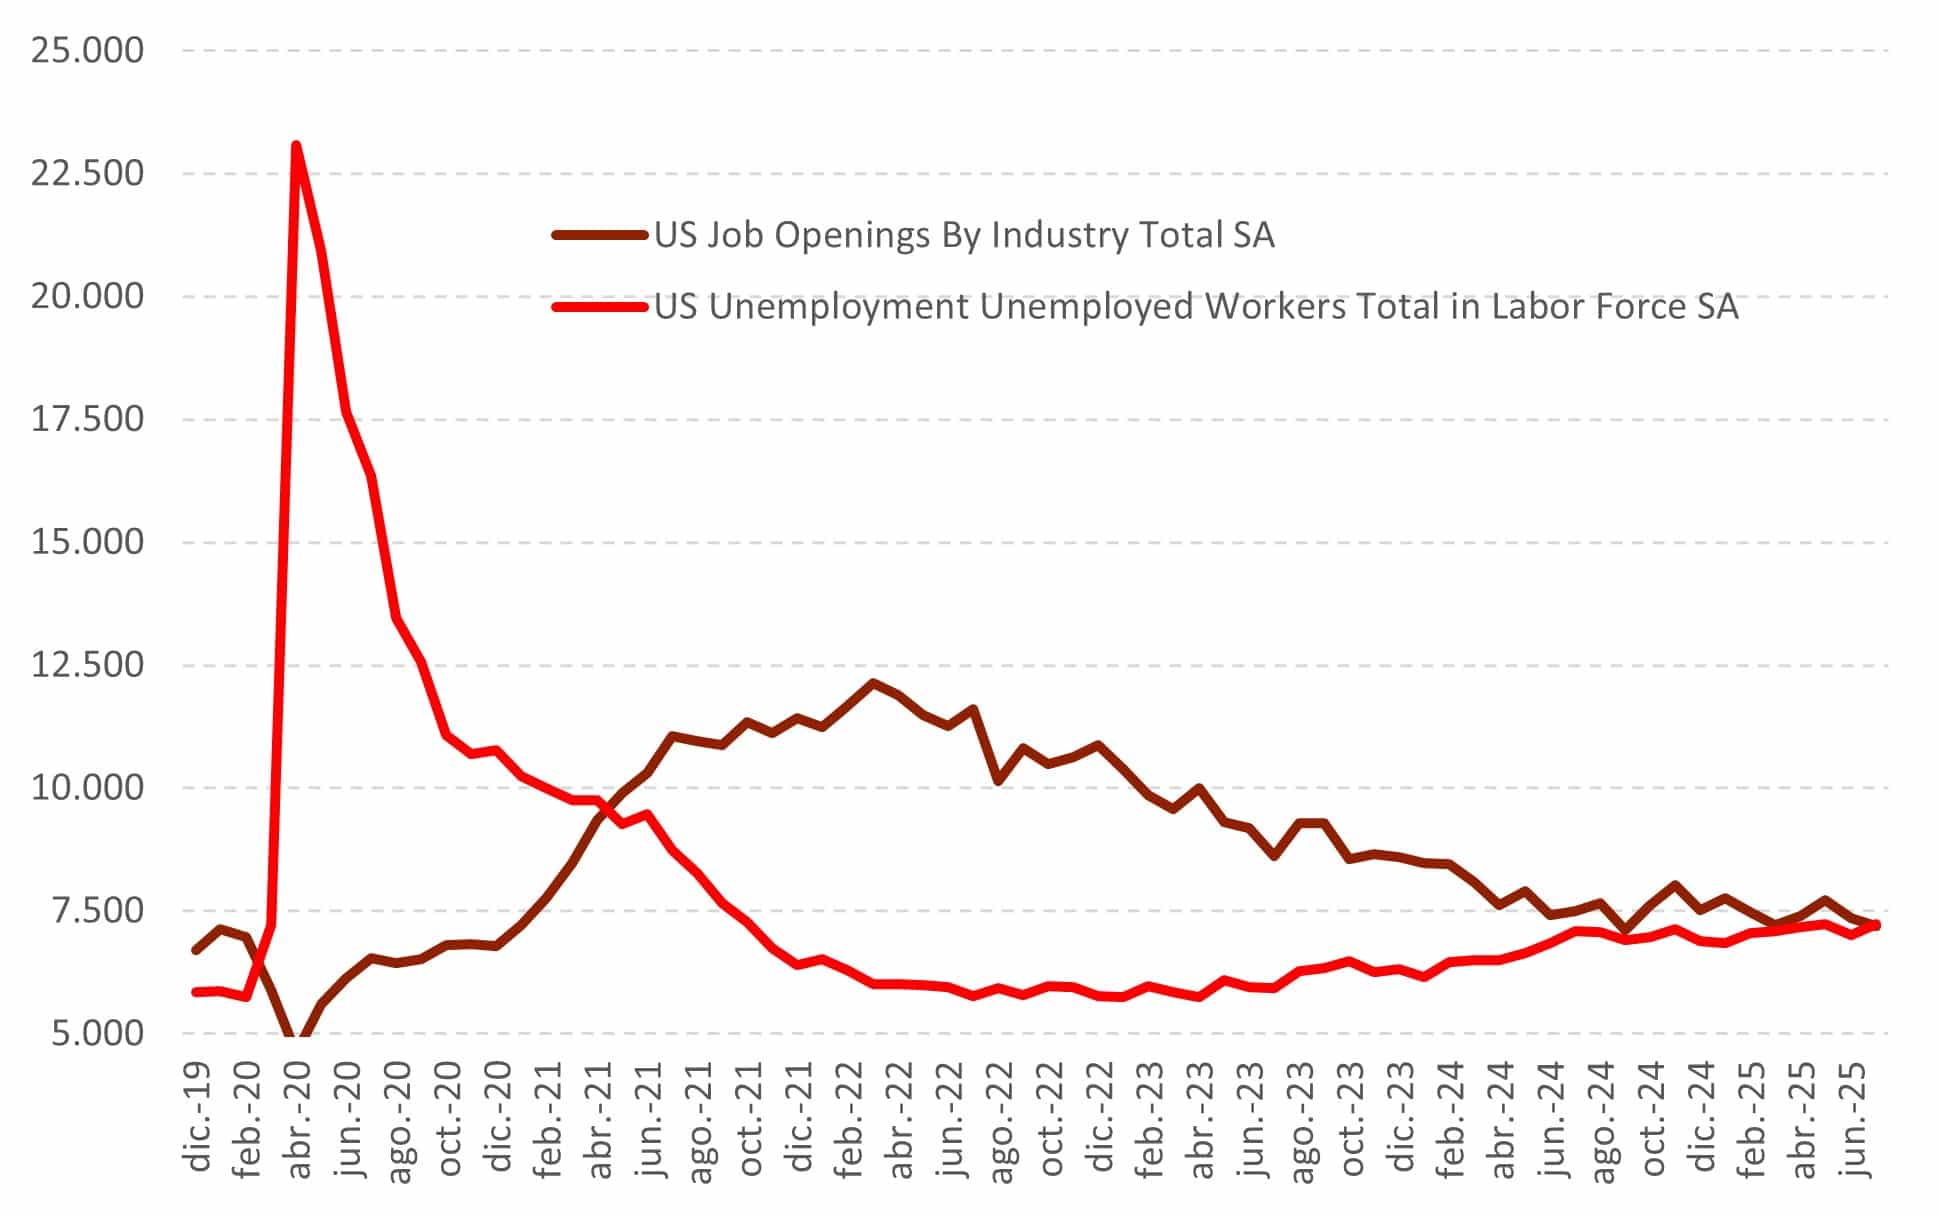
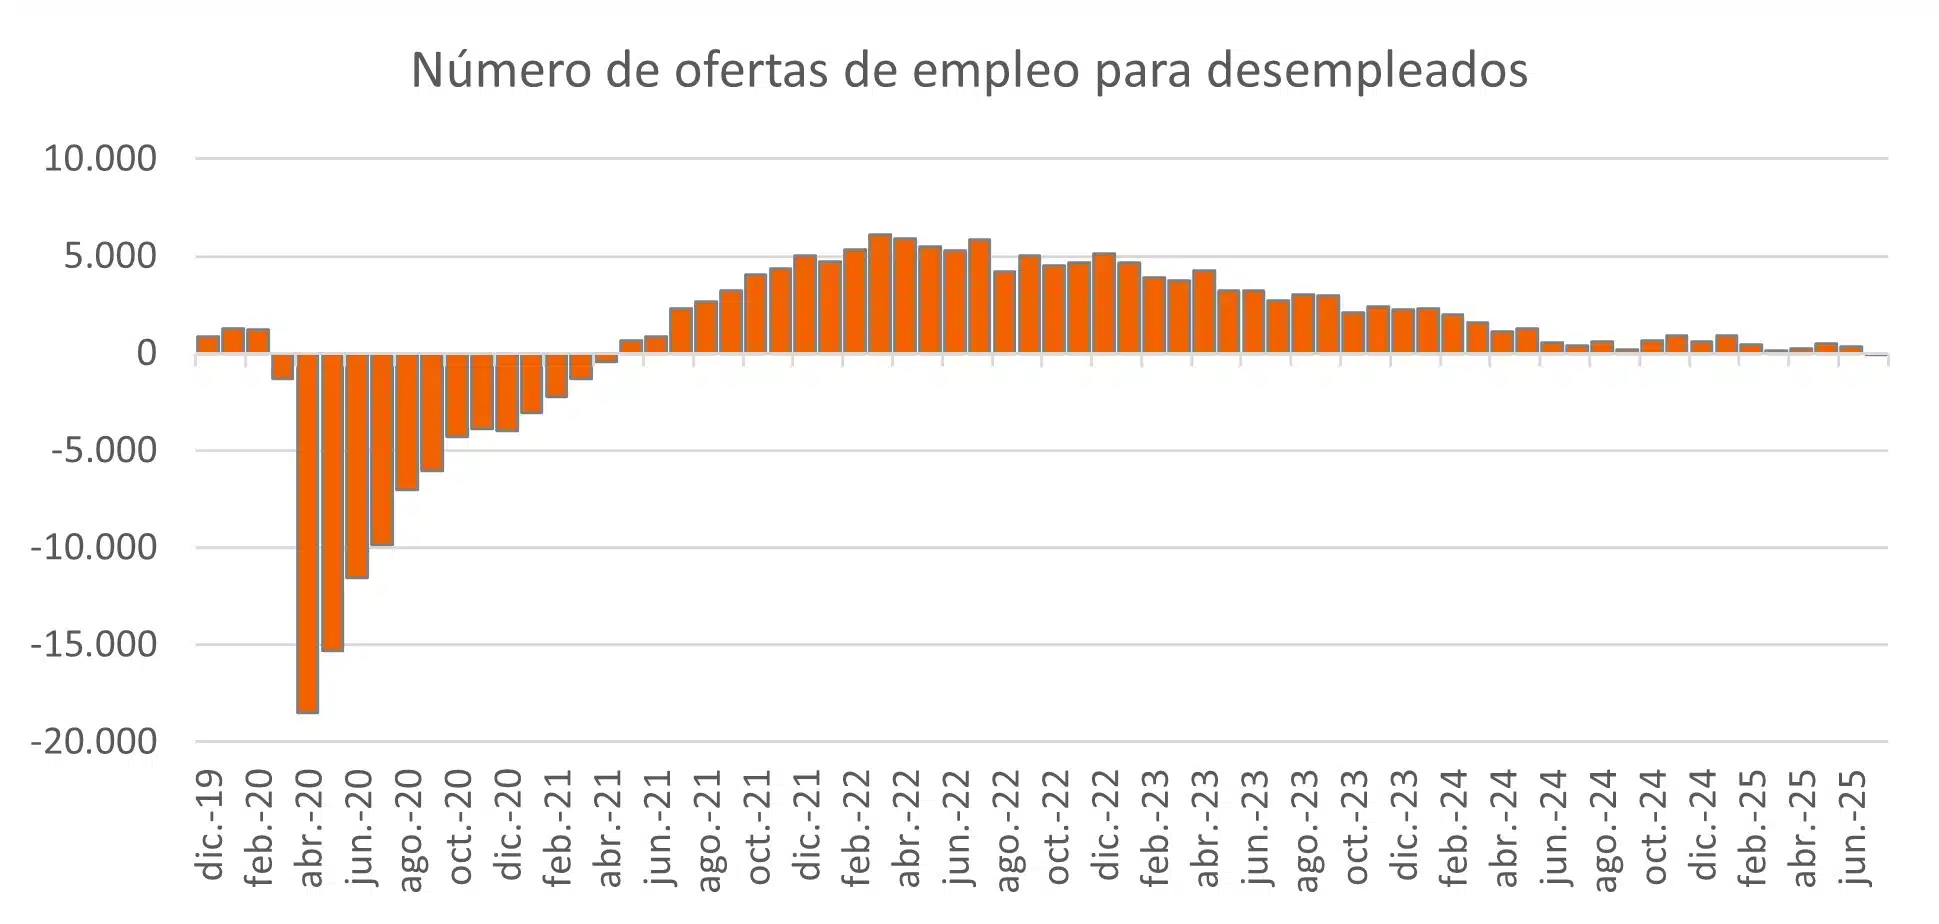
On the labor front, a second downward revi-sion to payroll data (now reflecting roughly 1 million fewer jobs) was compounded by weekly jobless claims, which picked up again in September to their highest levels since 2021. Continuing claims, which indicate longer unemployment spells, and JOLTS data on job openings showed further weakening: the ratio of vacancies to unemployed workers dropped to 1.07 from 1.16. Together, these indicators confirm that the U.S. labor market is softening and that downside risks to employment are building (see Chart 3).
Chart 3: JOLTS employment report data
Source: MAPFRE Economics (with Haver data)
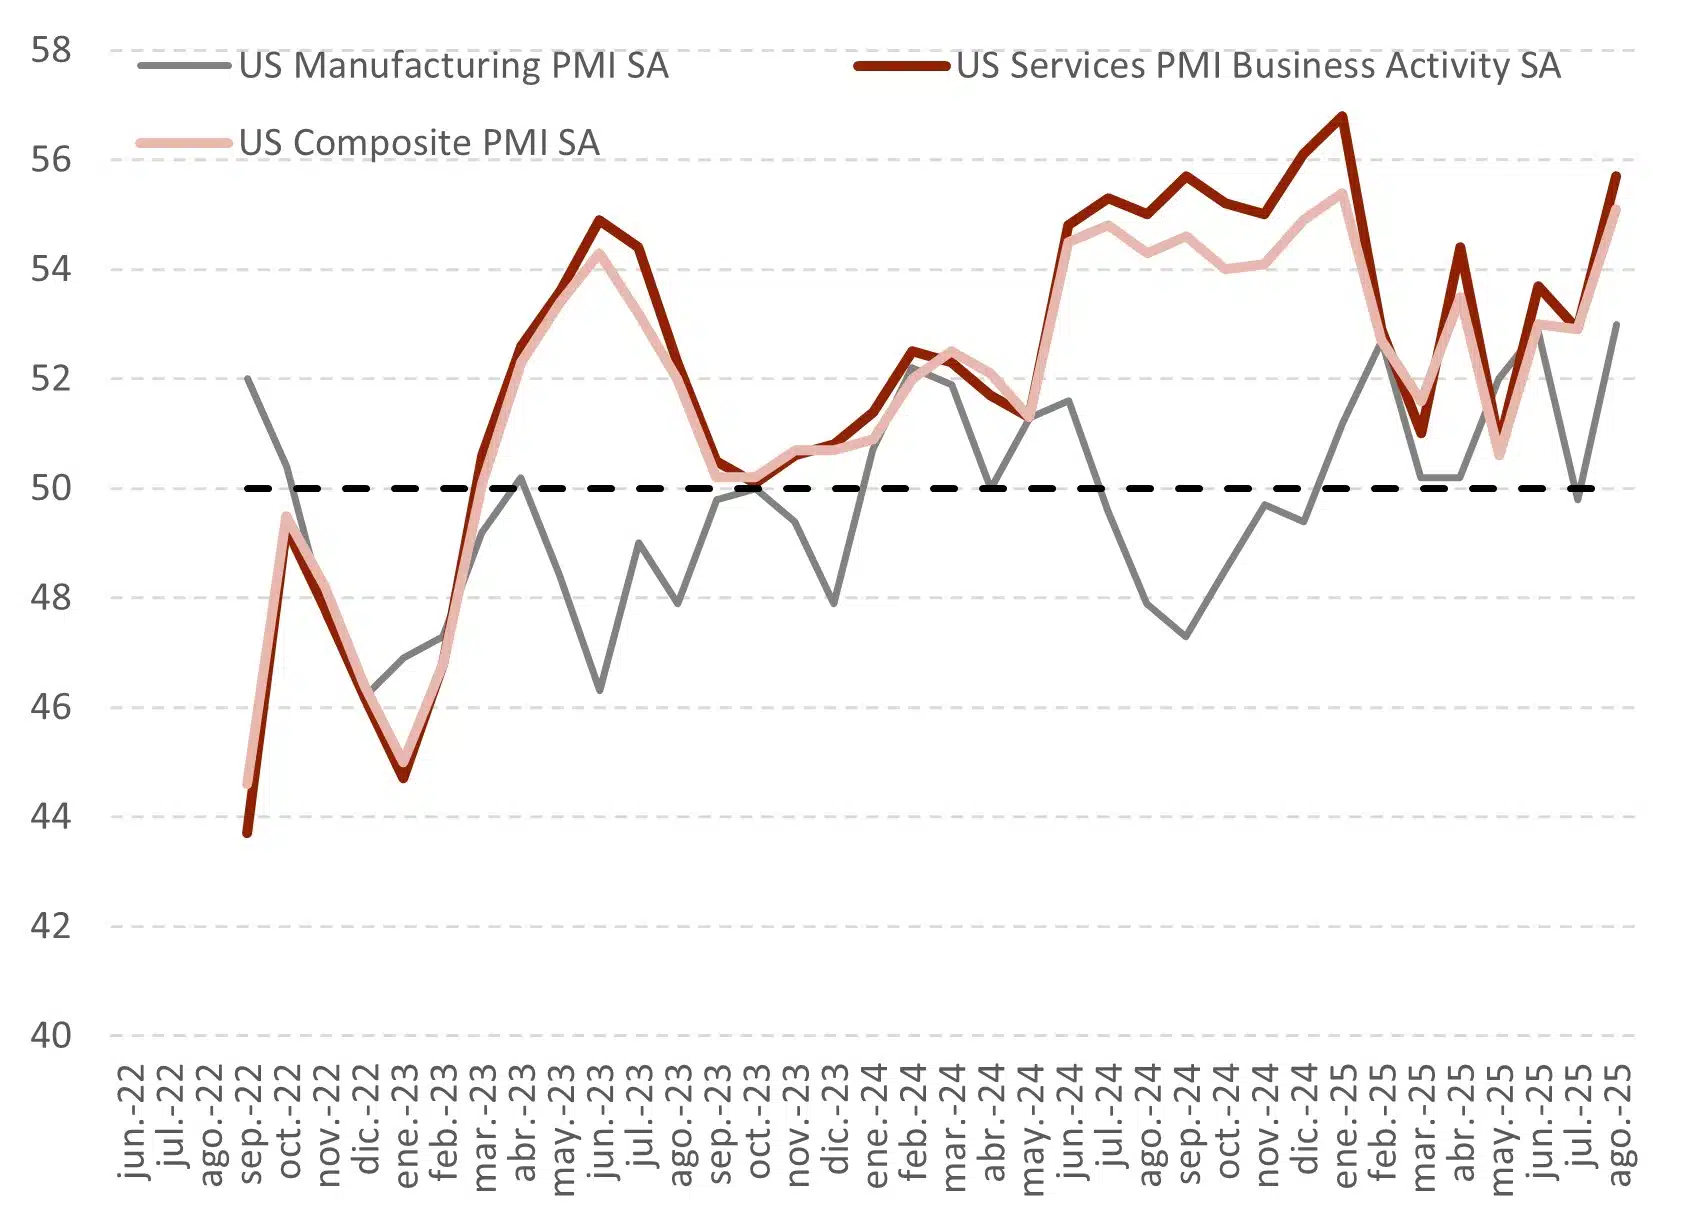
In terms of economic activity, GDP grew at an annual rate of 3.3% in Q2, supported by a decline in imports (partly offsetting the Q1 outlier) and stronger consumer spending, which helped counter weaker investment. High-frequency indicators show services PMIs easing to 54.5 (from 55.7), while manufacturing PMIs improved to 53.0 (from 49.8 in July). ISM surveys also strengthened, though the details point to emerging upside inflation risks as firms begin passing tariff-related costs on to consumers (see Chart 4).
As for inflation, the CPI rose 0.4% MoM (2.9% YoY), mainly driven by services (3.6%) and food (3.2%). Energy and goods, especially sensitive to the introduction of new tariffs, were only marginal contributors.
Chart 4: U.S. ISM and PMIs
Source: MAPFRE Economics (based on Bloomberg data)
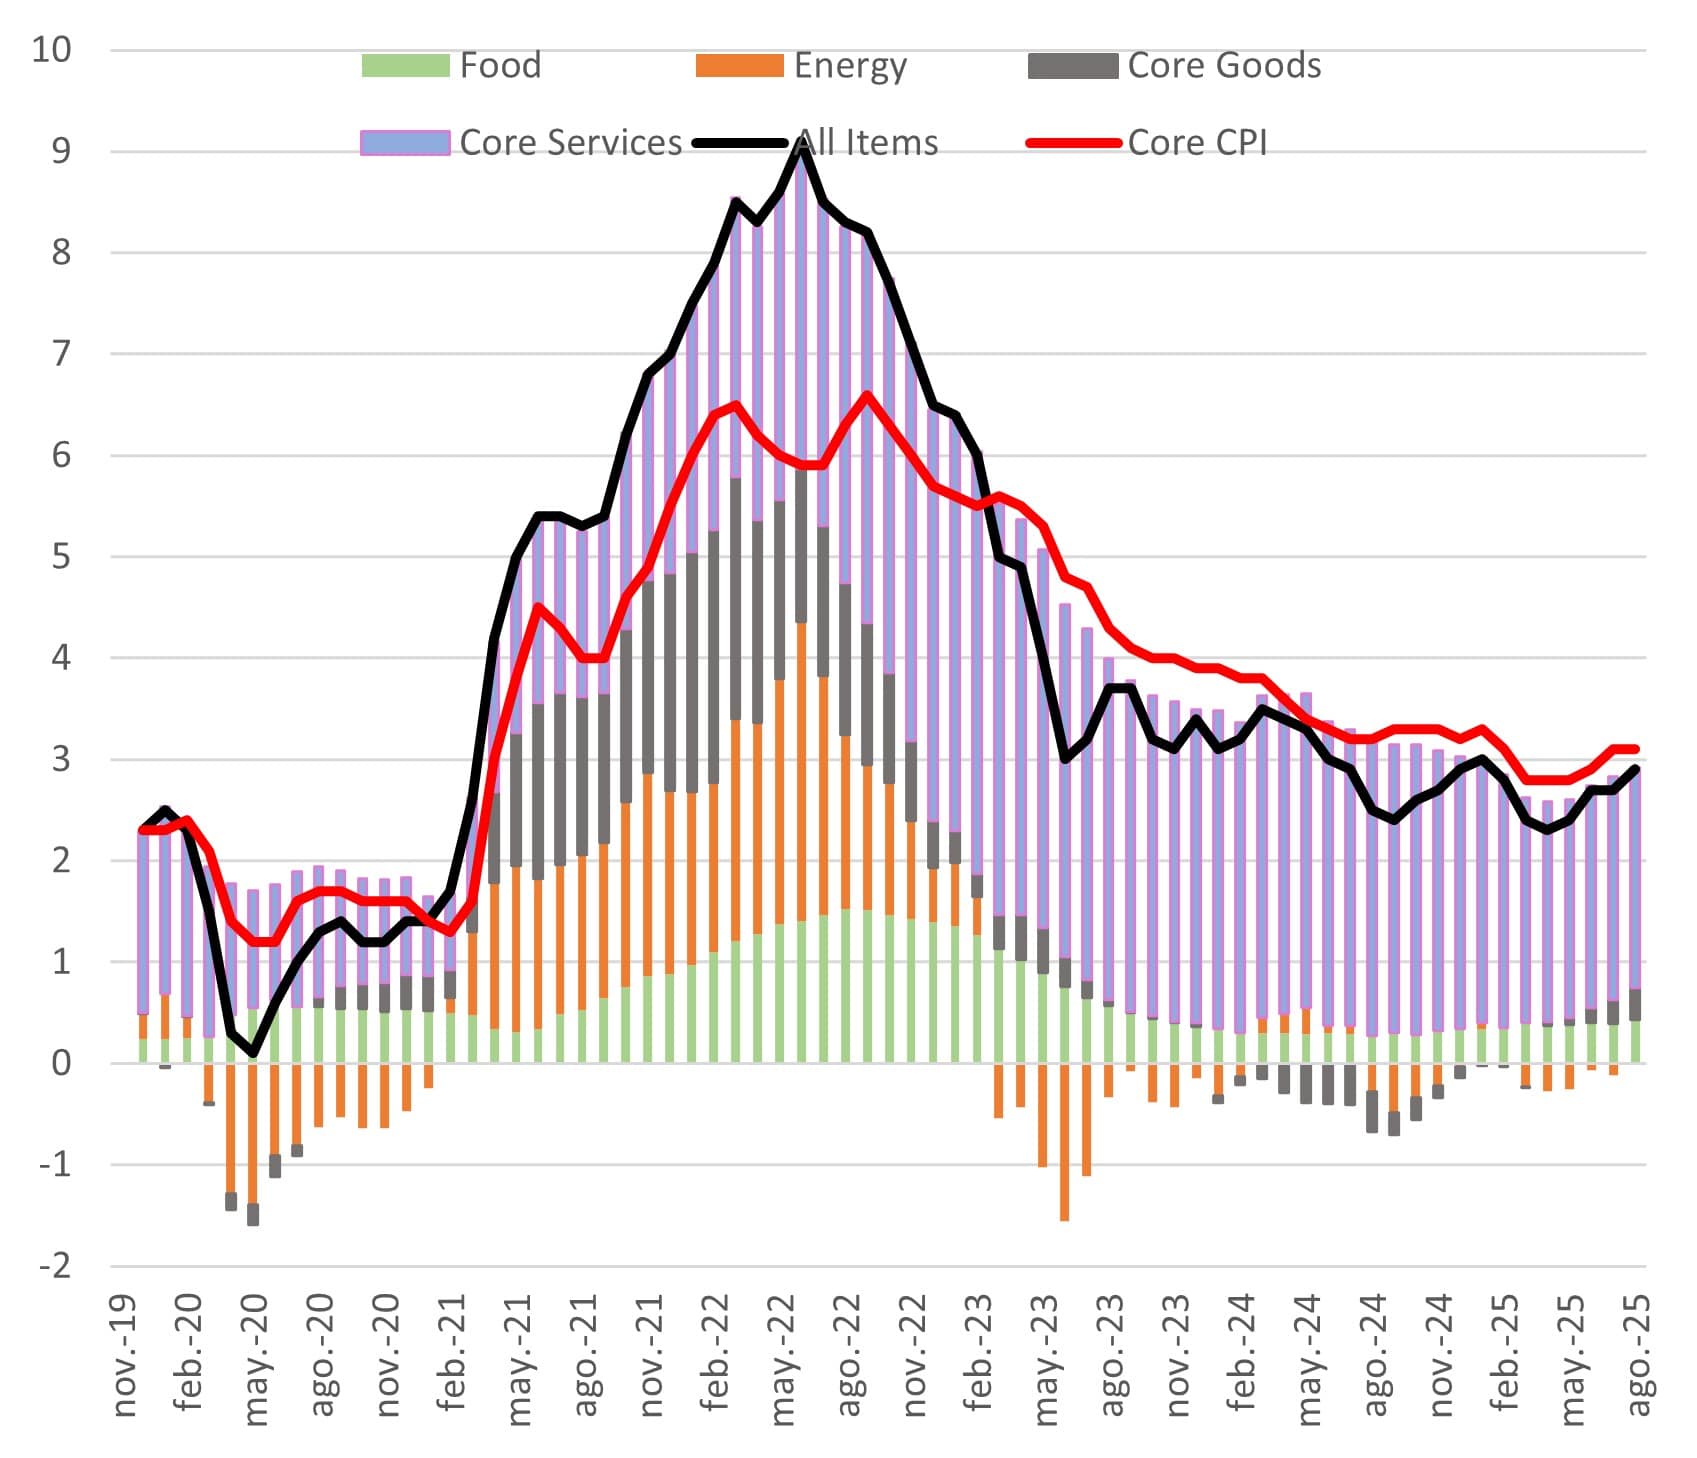
Core inflation rose 0.3% MoM (3.1% YoY), again driven by services, particularly housing, which increased 0.4% MoM (3.5% YoY). By contrast, the Producer Price Index (PPI) fell 0.1% MoM (2.6% YoY), reflecting weaker demand pressures and suggesting that, so far, tariffs have not generated meaningful inflationary effects. That said, if this slower pace of disinflation, driven largely by unfavorable base effects, persists in upcoming data, YoY inflation could move back above 3% (see Chart 5).
Chart 5: U.S. inflation by components
Source: MAPFRE Economics (with Haver data)
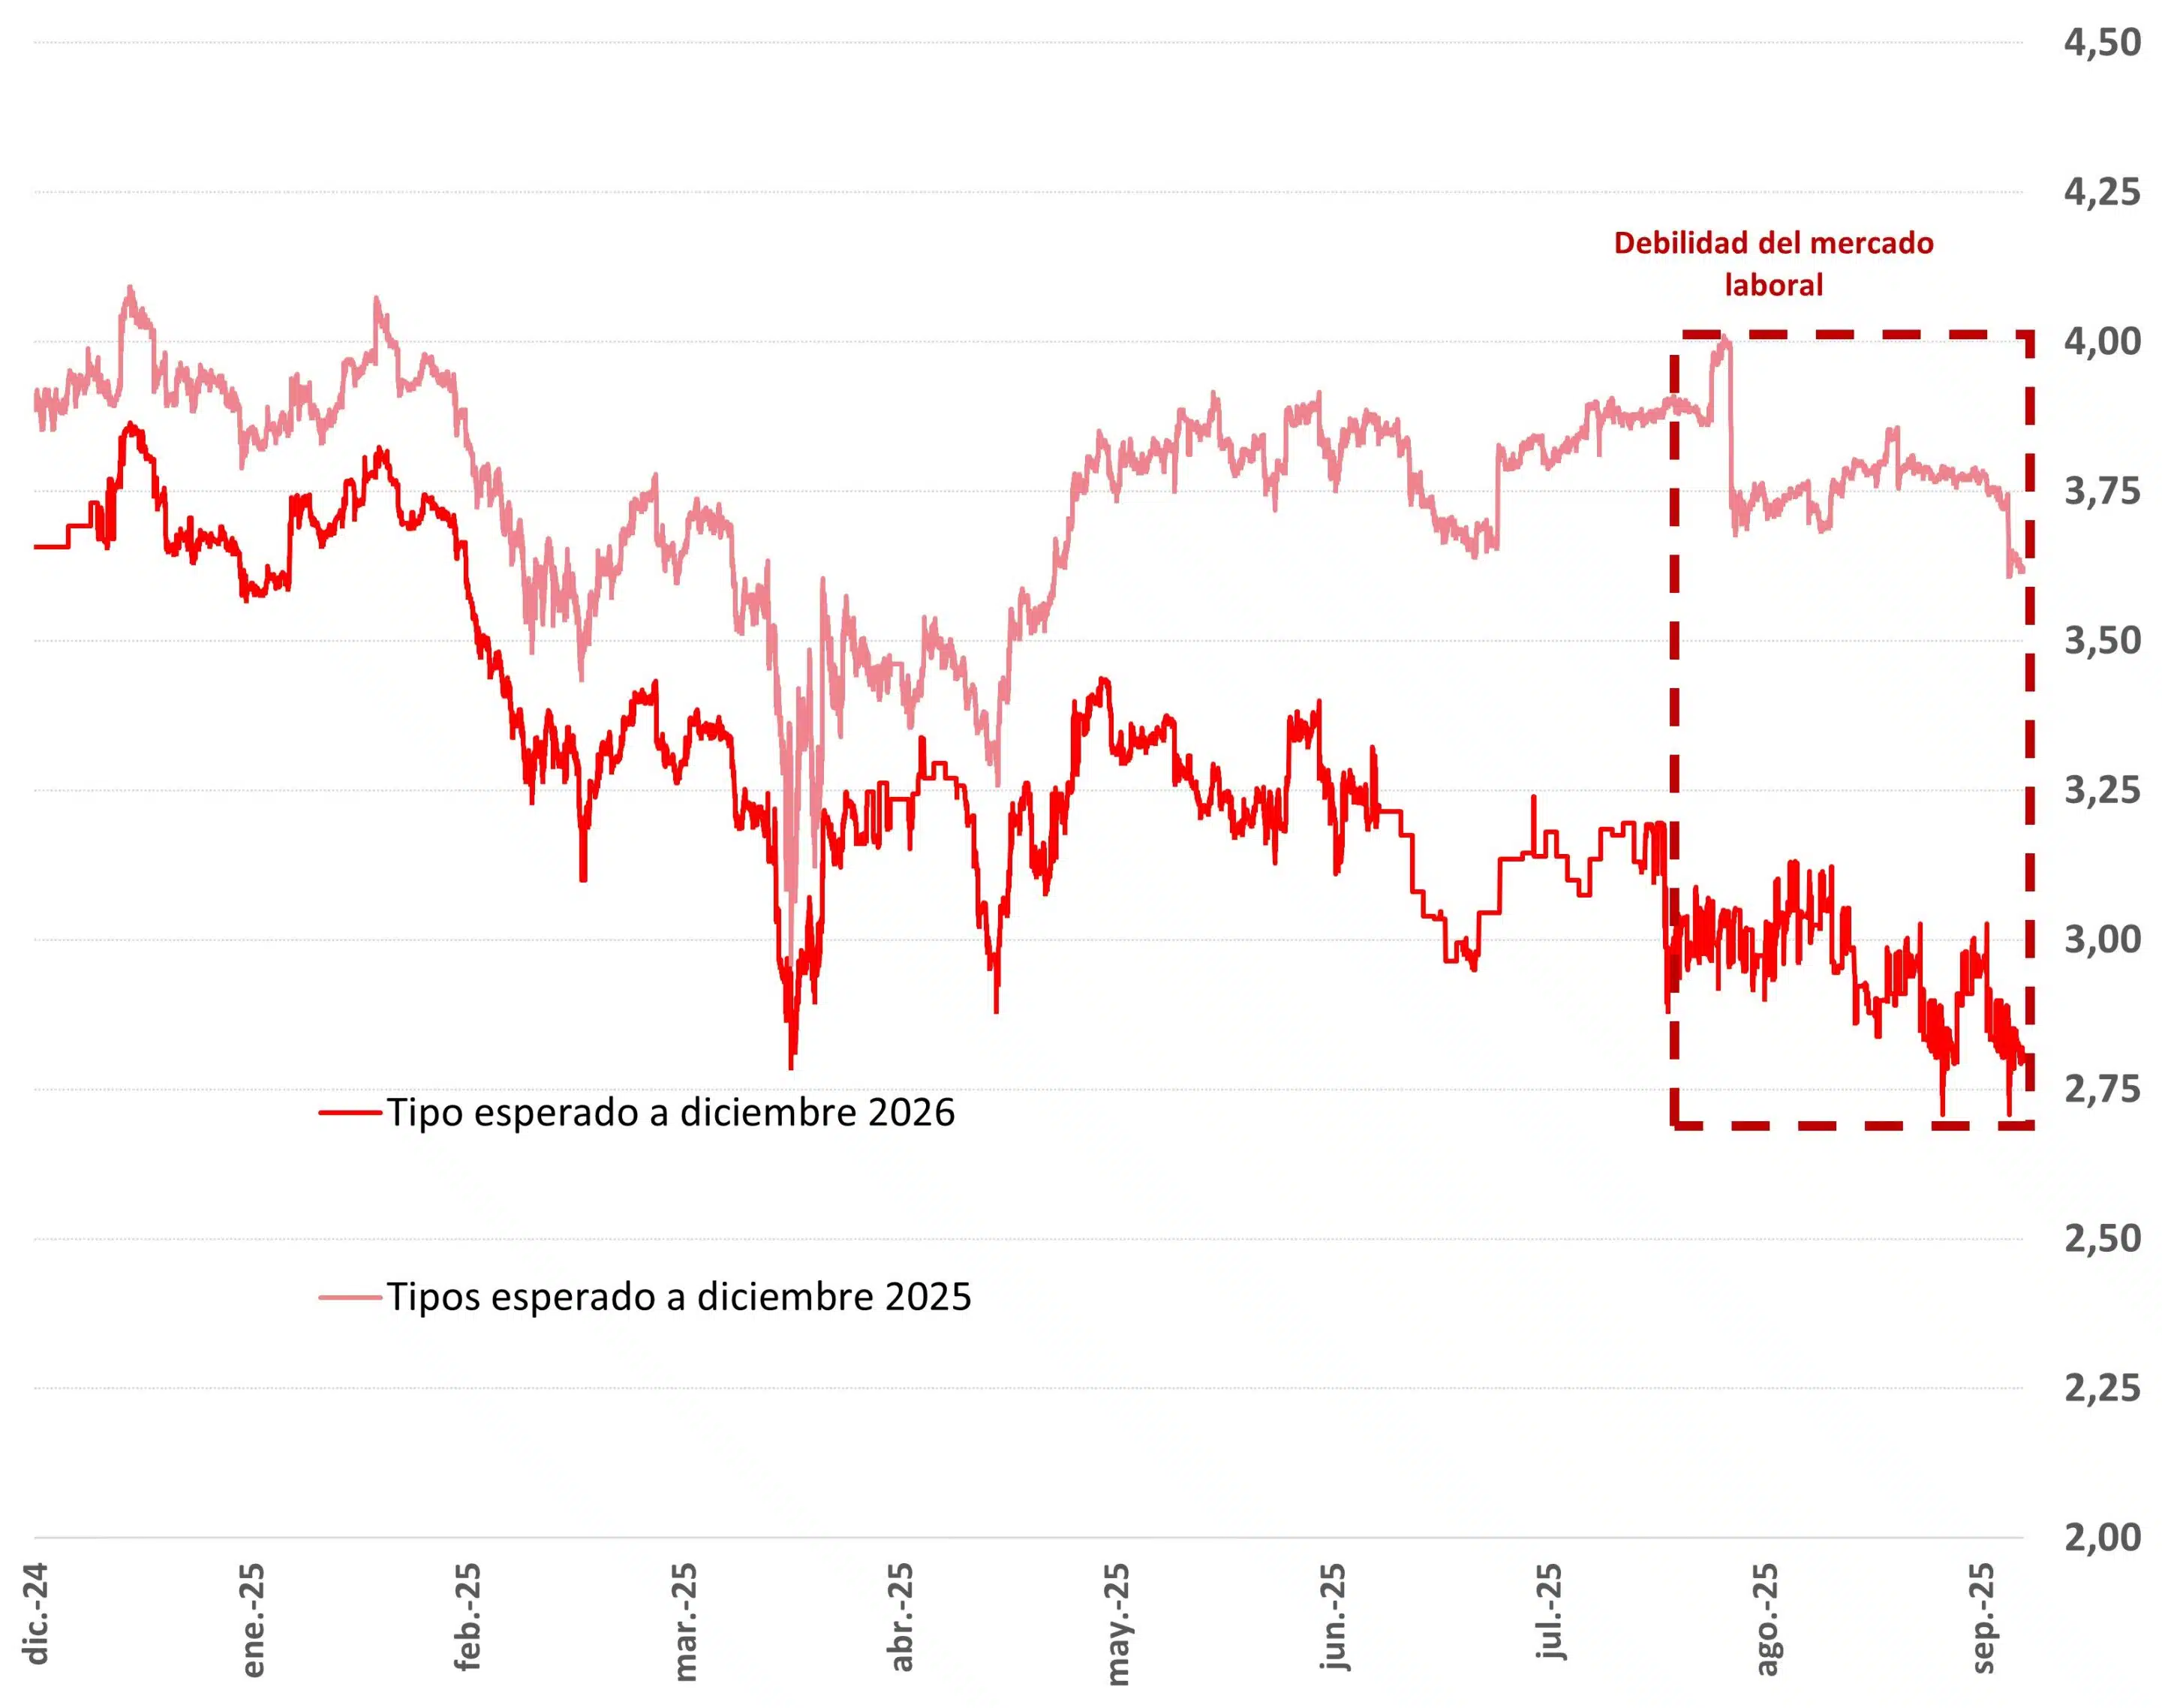
In summary, the latest labor-market data support both the rate cut and the path toward neutrality, with less dissent among FOMC members. At the same time, the decision is more closely aligned with market expectations, adding predictability and reinforcing a more conciliatory outlook going forward (see Chart 6). Still, safeguarding the Fed’s independence will remain a real-time challenge, as the line between fiscal and monetary policy continues to be open to interpretation.
Chart 6: SWAP-discounted interest rates
Source: MAPFRE Economics (based on Bloomberg data)