New Fed rate cut amid federal government shutdown

Redacción Mapfre
Eduardo García Castro, expert economist MAPFRE Economics
The U.S. Federal Reserve once again cut its benchmark interest rate by 25 basis points (bps), setting the target range at 3.75%–4.00%, in a decision that reflected a broadly consen-sual vote among members of the Federal Open Market Committee (FOMC). In addition, the Fed decided to halt its balance sheet reduction under the quantitative tightening (QT) program effective December 1, indicating that it will remain on hold for as long as necessary. From that date, the runoff of MBS (mortgage-backed securities) will continue at the previous pace, with the proceeds used to finance purchases of Treasury bills, while the proceeds from maturing Treasury securities will be fully rolled over at auction. All details were outlined in a supplemental explanatory note.
Assessment
Since the last meeting, the flow of new information available for analysis has been limited by the government shutdown, which has delayed the release of key economic data. Even so, the data published so far points to a broadly steady trend, consistent with the Fed’s previous narrative and balance of risks. The labor market continues to show signs of gradual cooling, overall activity has remained unexpectedly resilient, and inflation—though still above target—posted another decline in September. Accordingly, in the absence of major surprises, the Fed’s plan to proceed with a gradual path of monetary easing remains on track, with the policy roadmap still pointing toward a more neutral stance. Notably, and justified by the recent deterioration in money market conditions, the Fed announced the end of quantitative tighten-ing (QT). While this step responds to only moderate pressures for now, it marks a clear turning point in the central bank’s policy trajectory
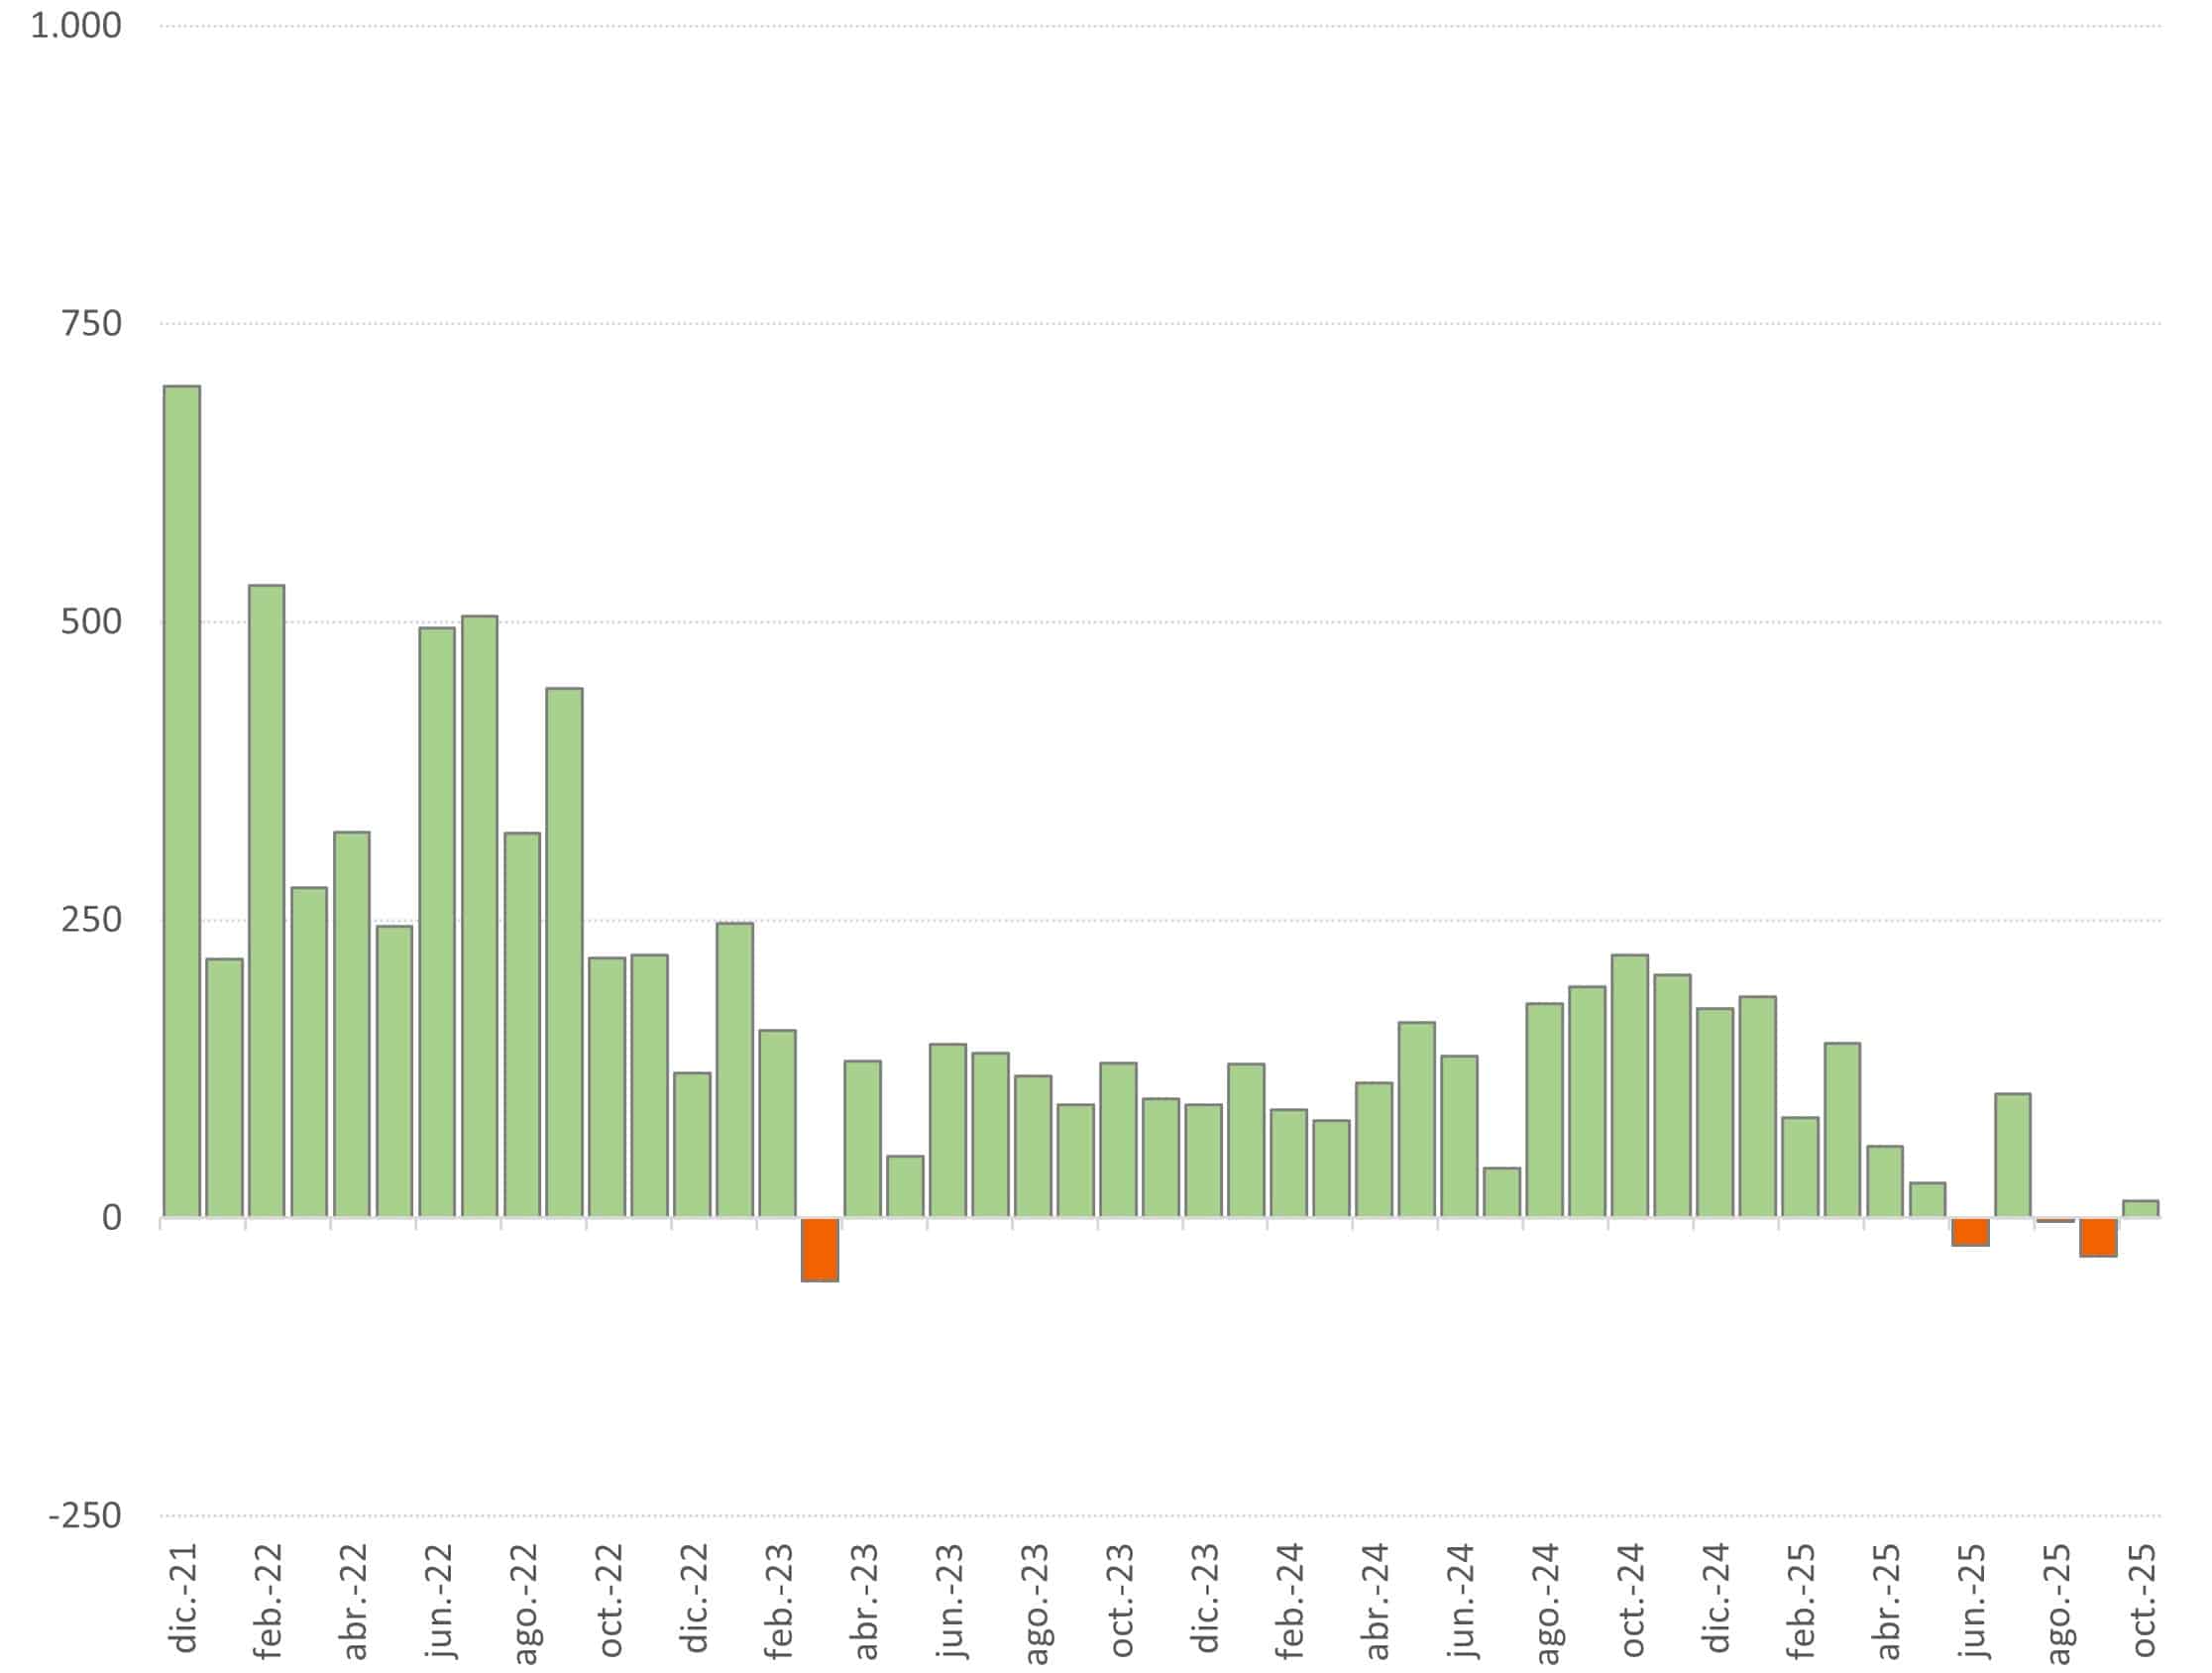
On the labor front, the ongoing lack of official statistics due to the government shutdown has made it difficult to form an up-to-date view of employment trends. Nevertheless, alternative indicators such as the ADP report—which points to net job losses over the past three months (see Chart 1)—along with various sentiment surveys, suggest a degree of stabilization. At the same time, both initial and continuing jobless claims, based on state-level data, have remained virtually unchanged throughout October, providing little additional insight. In summary, labor market dynamics remain broadly consistent with the Fed’s September baseline scenario, in which the balance of risks was recalibrated.
Chart 1: ADP Employment
Source: MAPFRE Economics (with Haver data)
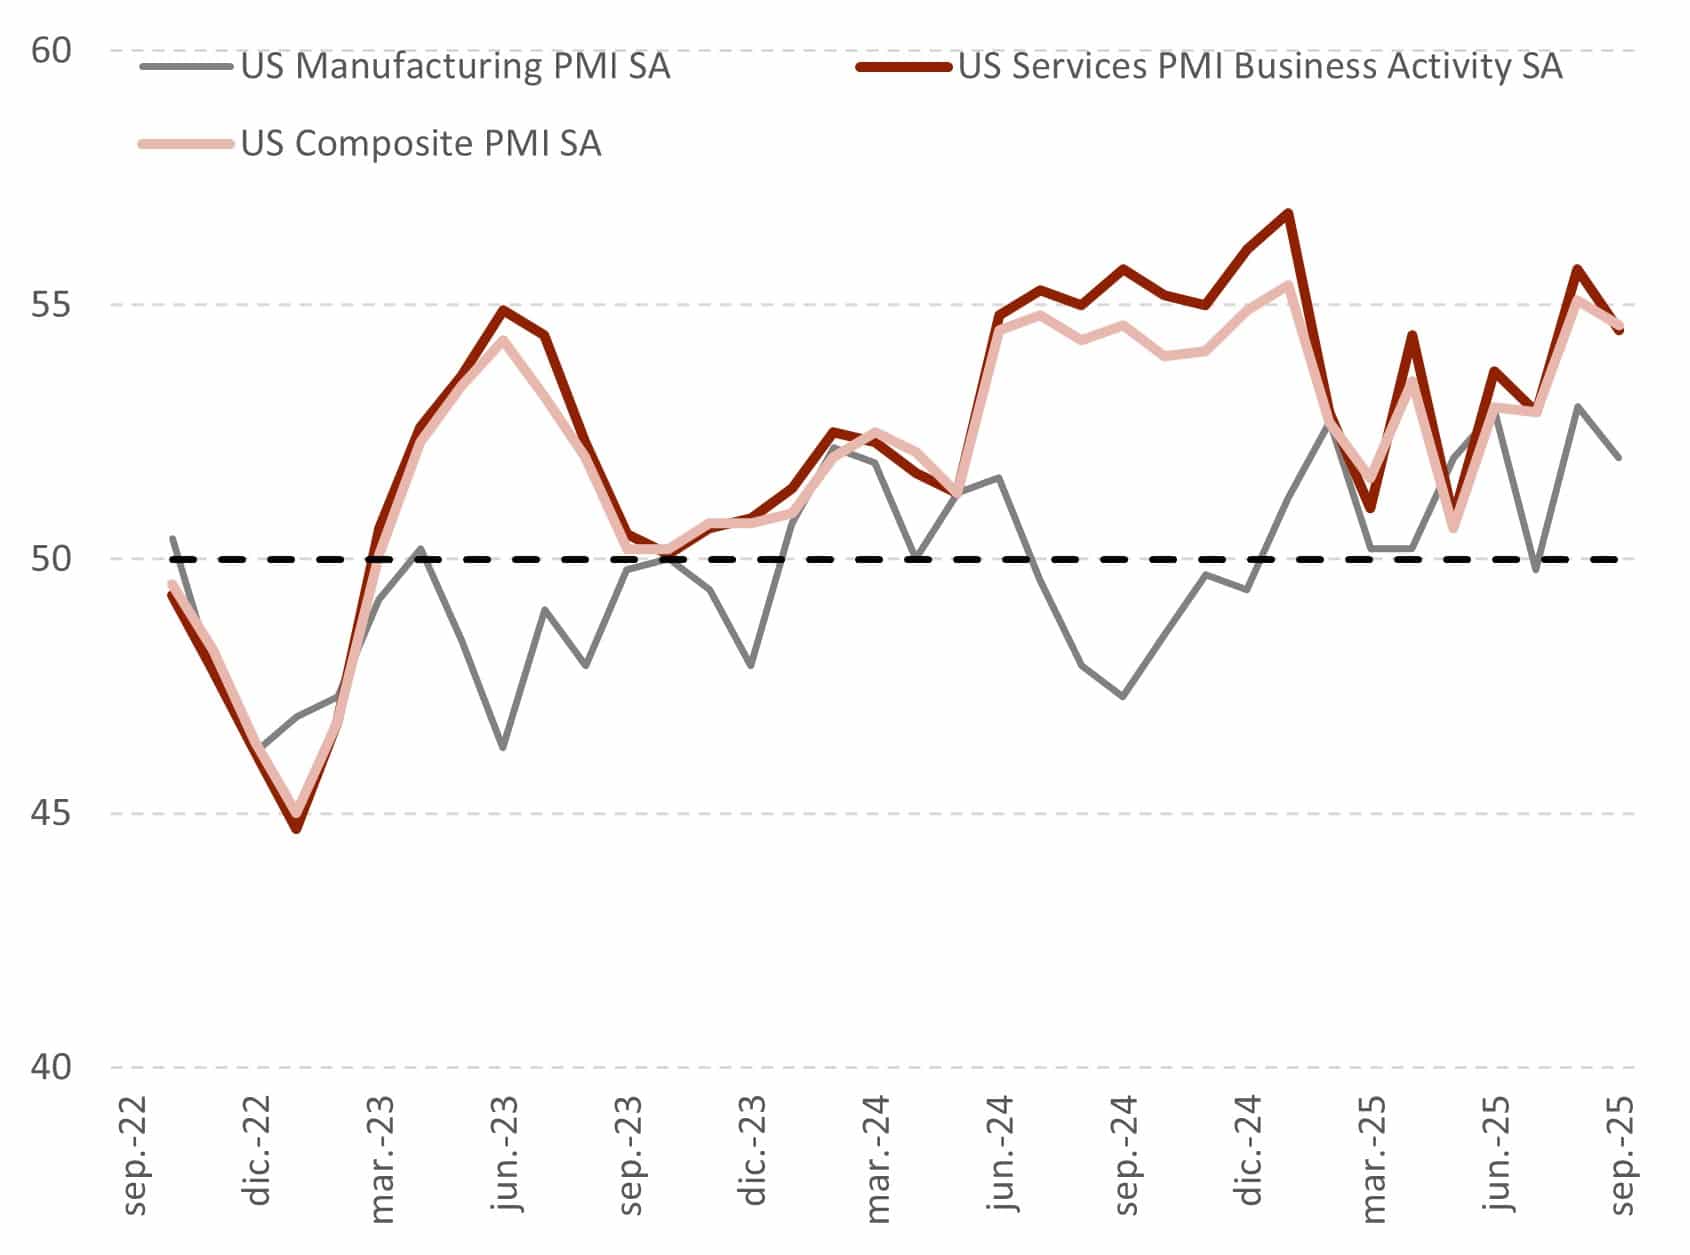
Turning to activity, the latest October PMIs (see Chart 2) suggest that economic activity picked up again during the month, with both the manufacturing and services sectors expanding at a pace consistent with GDP growth of around 2.5%. When incorporating investment growth estimates—driven largely by private investment and, in particular, strong momentum in data center construction—overall GDP growth could well exceed 3%, as indicated by the Atlanta Fed’s GDPNow projections (see Chart 3).
Chart 2: U.S. PMIs
Source: MAPFRE Economics (based on Bloomberg data)
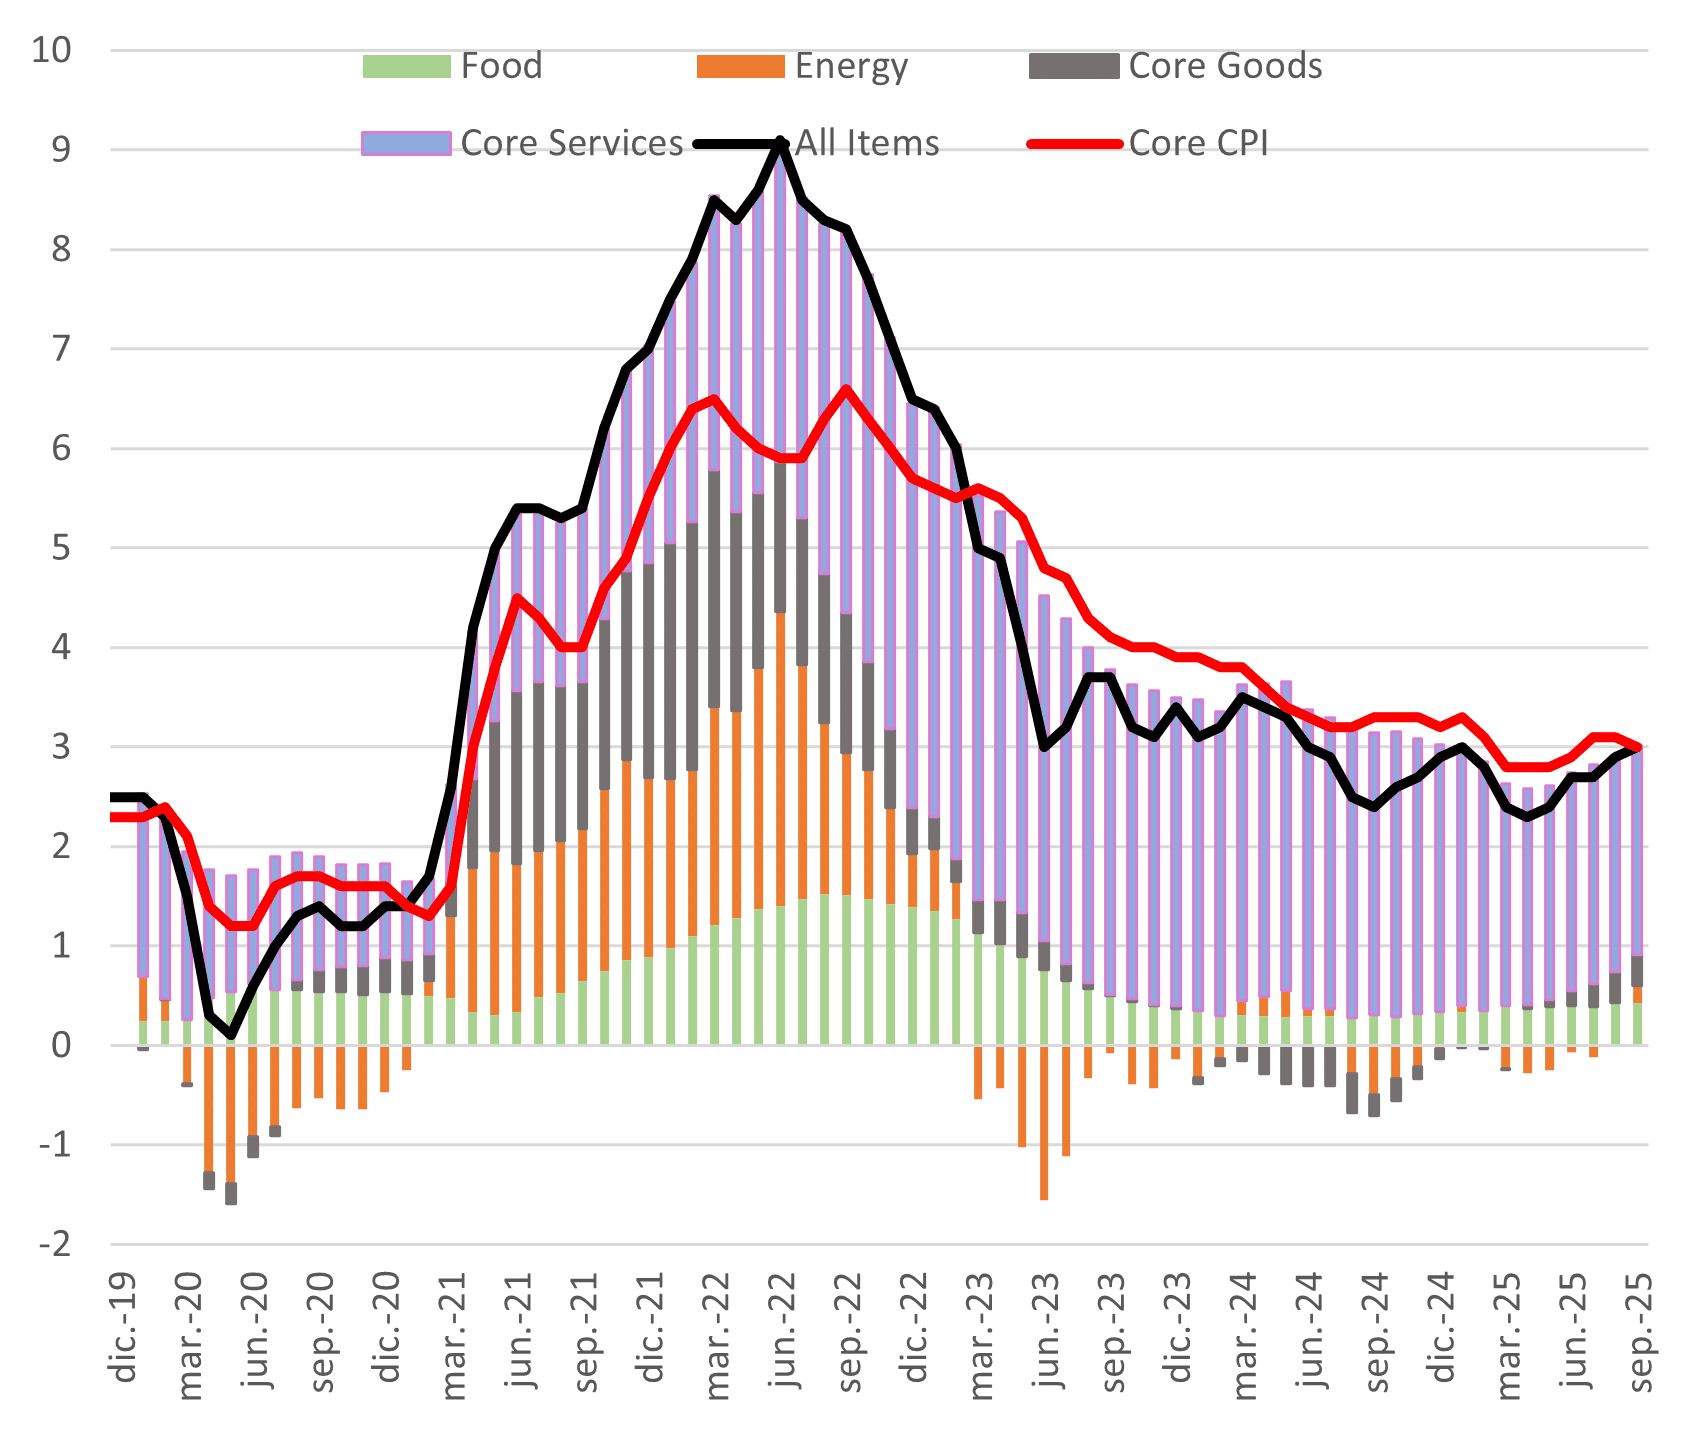
As for inflation, the September report showed a 0.3% MoM increase (3.0% YoY), driven mainly by a rebound in energy prices (+1.5% MoM; +2.8% YoY) and food prices (+0.2% MoM; +3.1% YoY). Goods inflation remained moderate (+0.2% MoM; +1.5% YoY), while services inflation continued to ease (+0.2% MoM; +3.5% YoY). As a result, core inflation stood at 3.0% YoY, indicating that, so far, there are still no visible signs of inflationary pressures stemming from tariffs (see Chart 3).
Chart 3: U.S. inflation by components
Source: MAPFRE Economics (with Haver data)
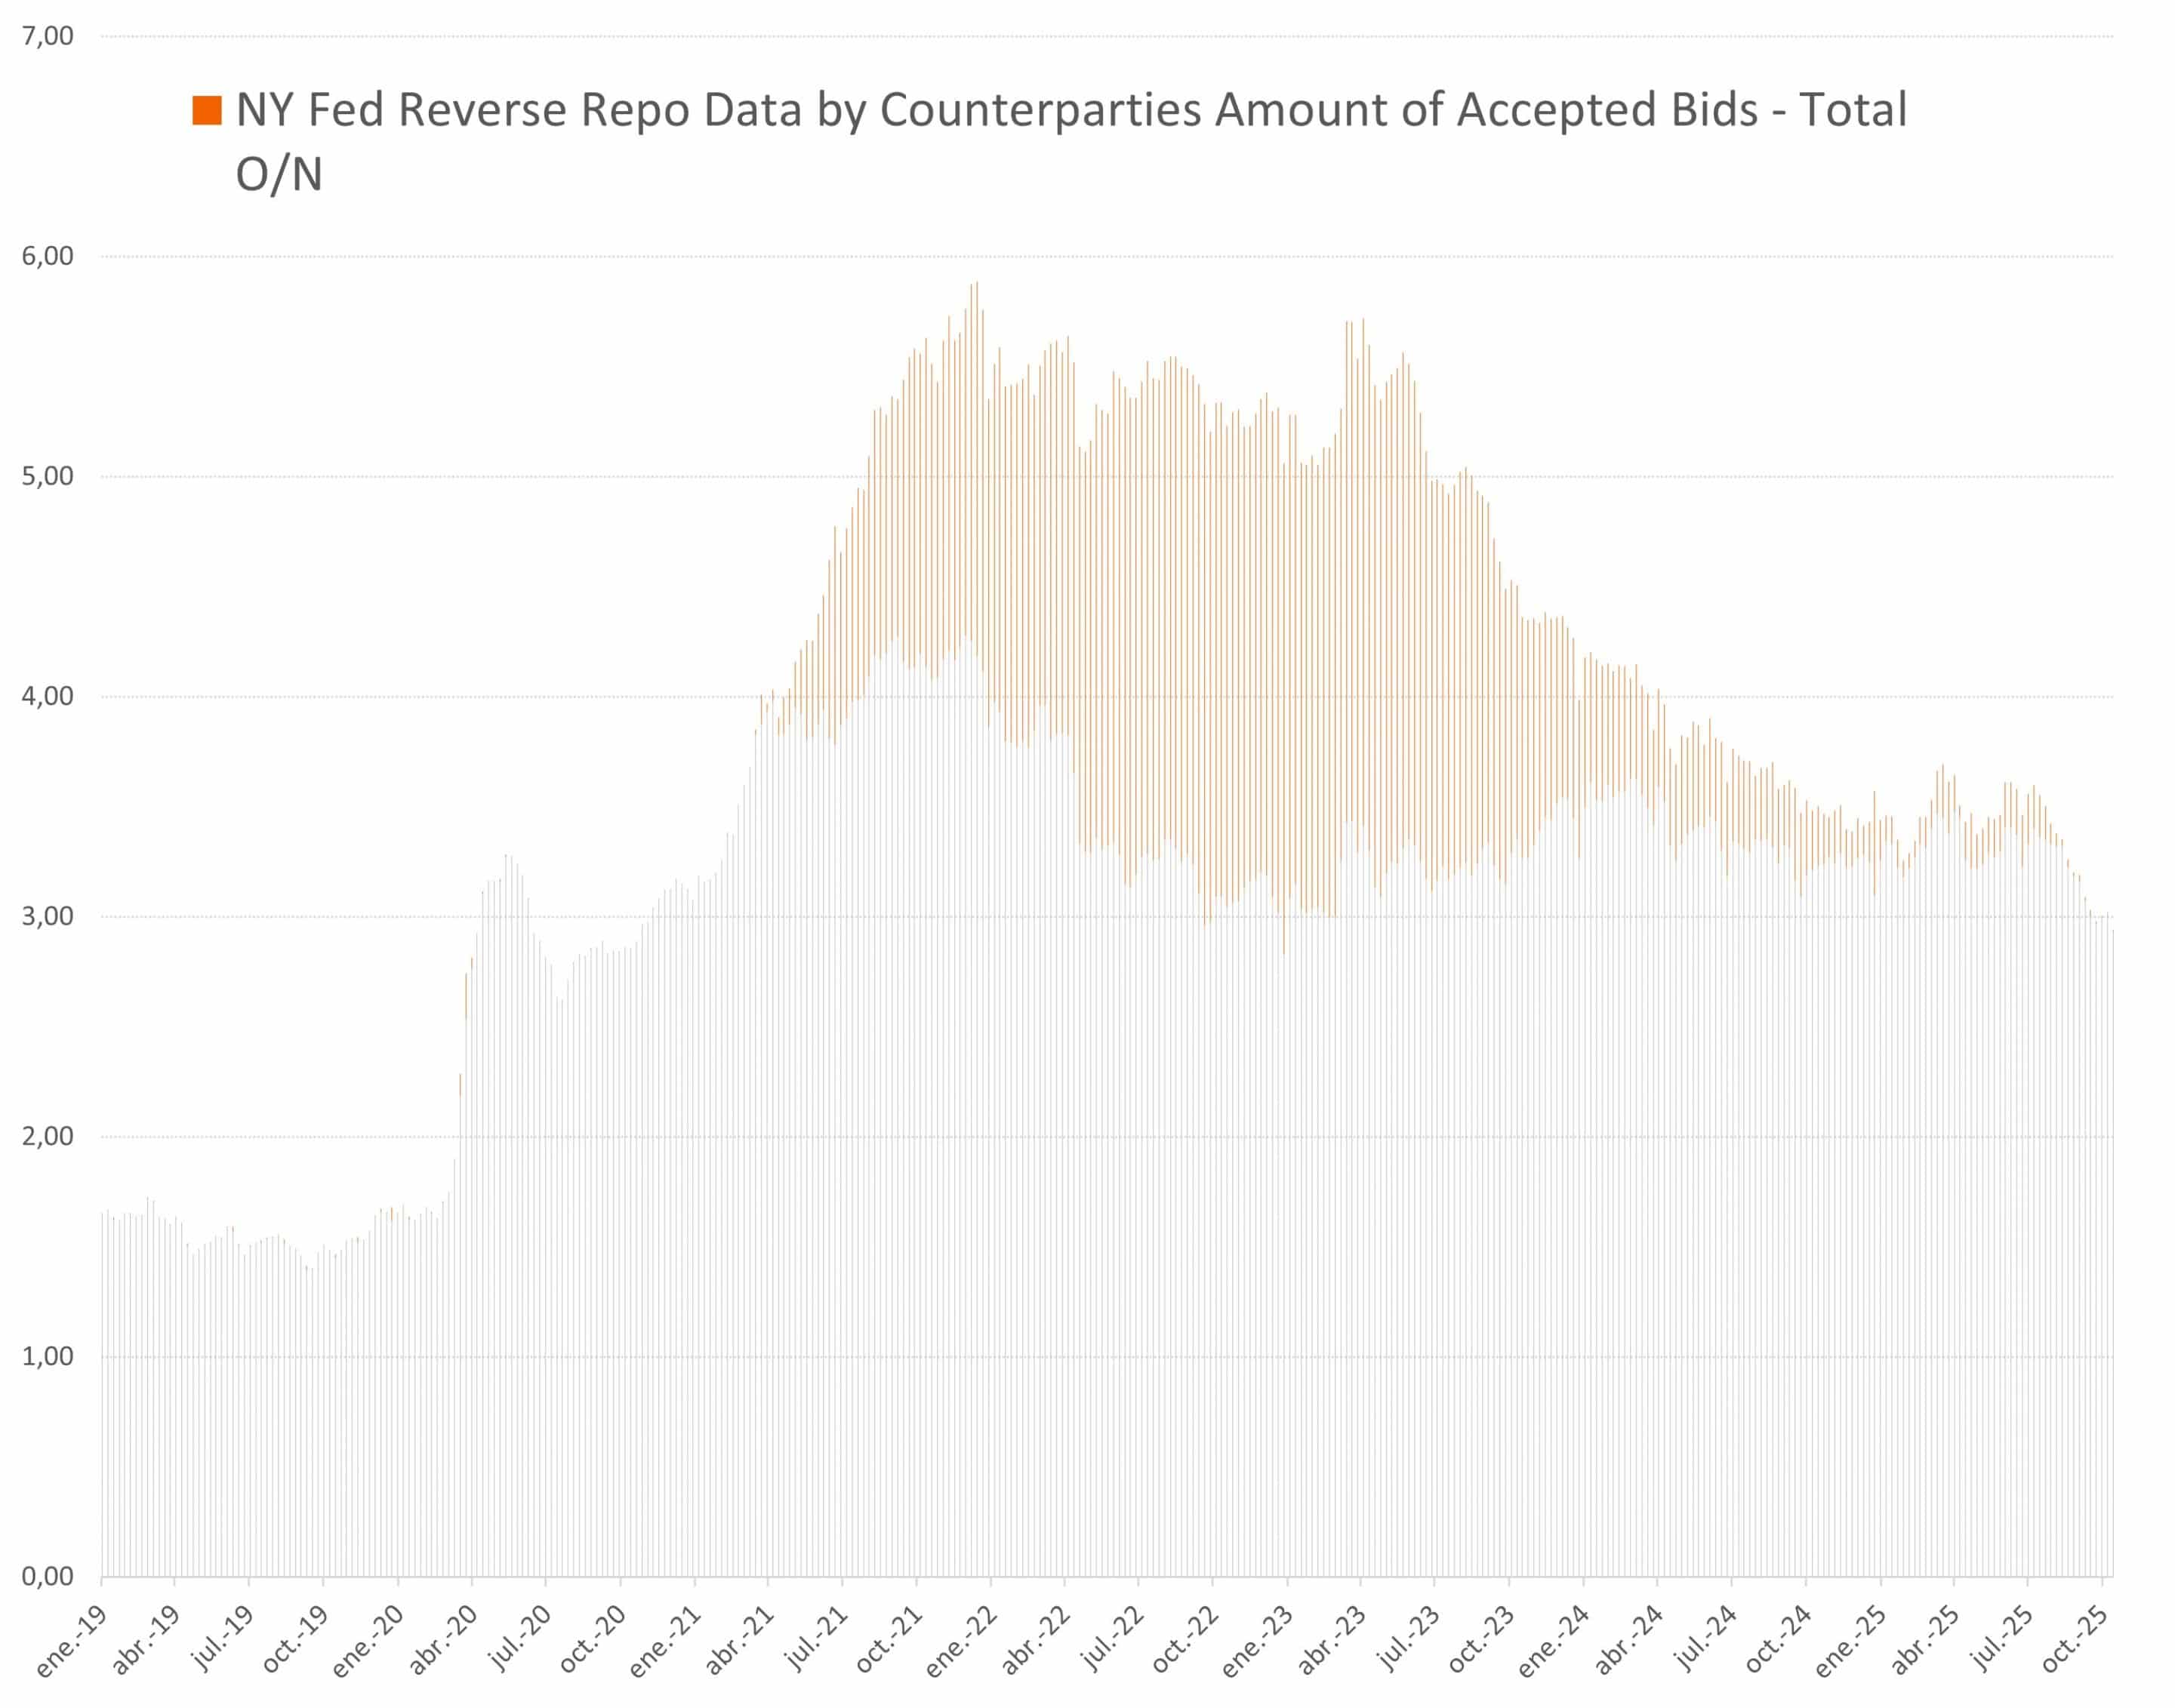
Lastly, and closely linked to the decision to halt balance sheet reduction under QT, the exhaustion of repo operations—together with bank reserves gradually approaching more con-strained levels (moving away from what the Fed itself classifies as “ample”)—appears to provide sufficient reason for the central bank to act with some caution at this stage. In this regard, although there have been no early signs of severe liquidity stress, past experience underscores the value of taking preventive action as the period of excess liquidity draws to a close (see Charts 4 and 5).
Chart 4: Repos and reserves in the system
Source: MAPFRE Economics (based on Bloomberg data)
Chart 5: One-day repo operations
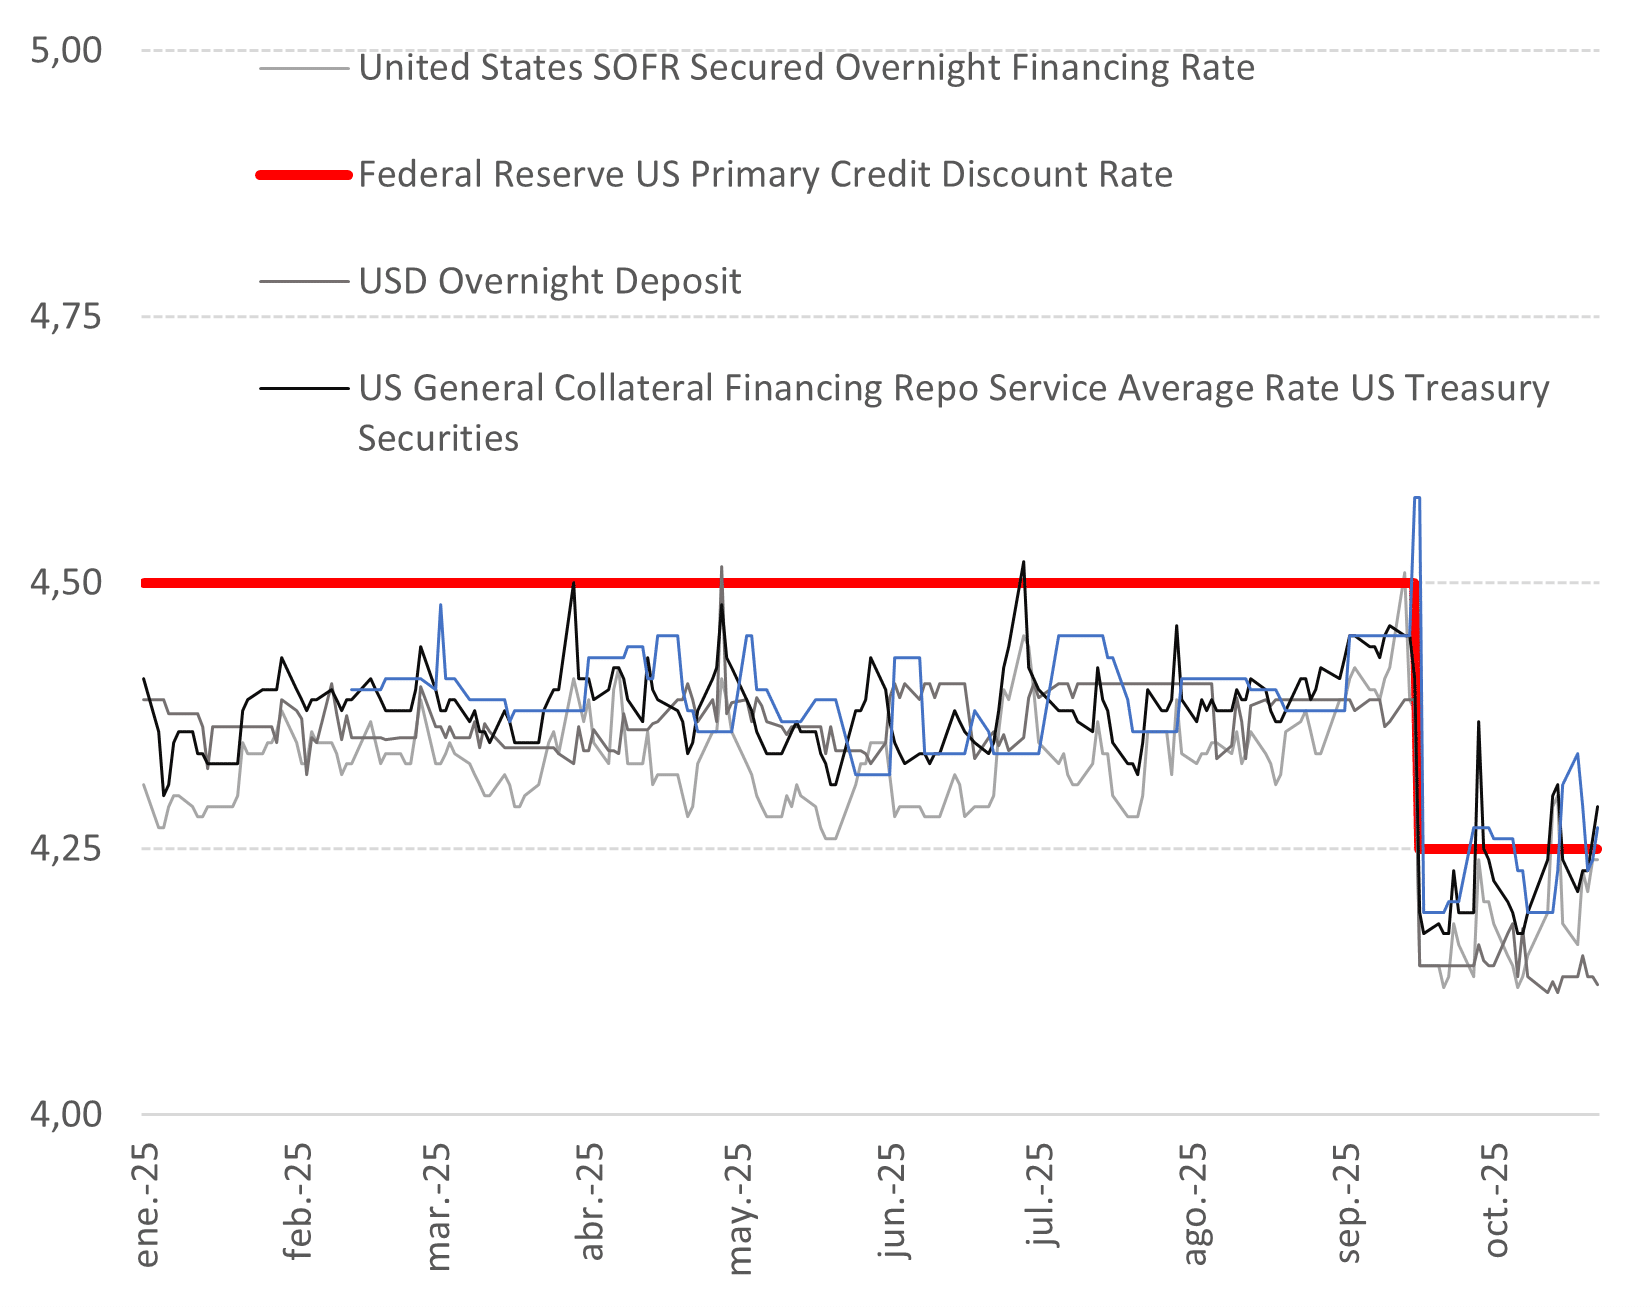
Source: MAPFRE Economics (based on Bloomberg data)
In conclusion, the data still appears to give the Fed leeway to continue lowering interest rates, albeit partly in the dark. The delay in government data releases makes it harder to fully assess the economic landscape, but not enough to alter the September outlook, when the narrowing gap between inflation and employment objectives helped rebalance the overall risk assessment. This brings little change to interest rate expectations for the remainder of the year and for 2026 (see Chart 6), but it also does not warrant a firm com-mitment to that path going forward. The probability of a 25-basis-point rate cut in December has fallen from 95% to 70%. Therefore, now that balance sheet normalization has concluded, optionality will remain the prevailing approach within the FOMC, allowing policymakers to maintain flexibility and respond swiftly to future economic develop-ments.
Chart 6: SWAP-discounted interest rates
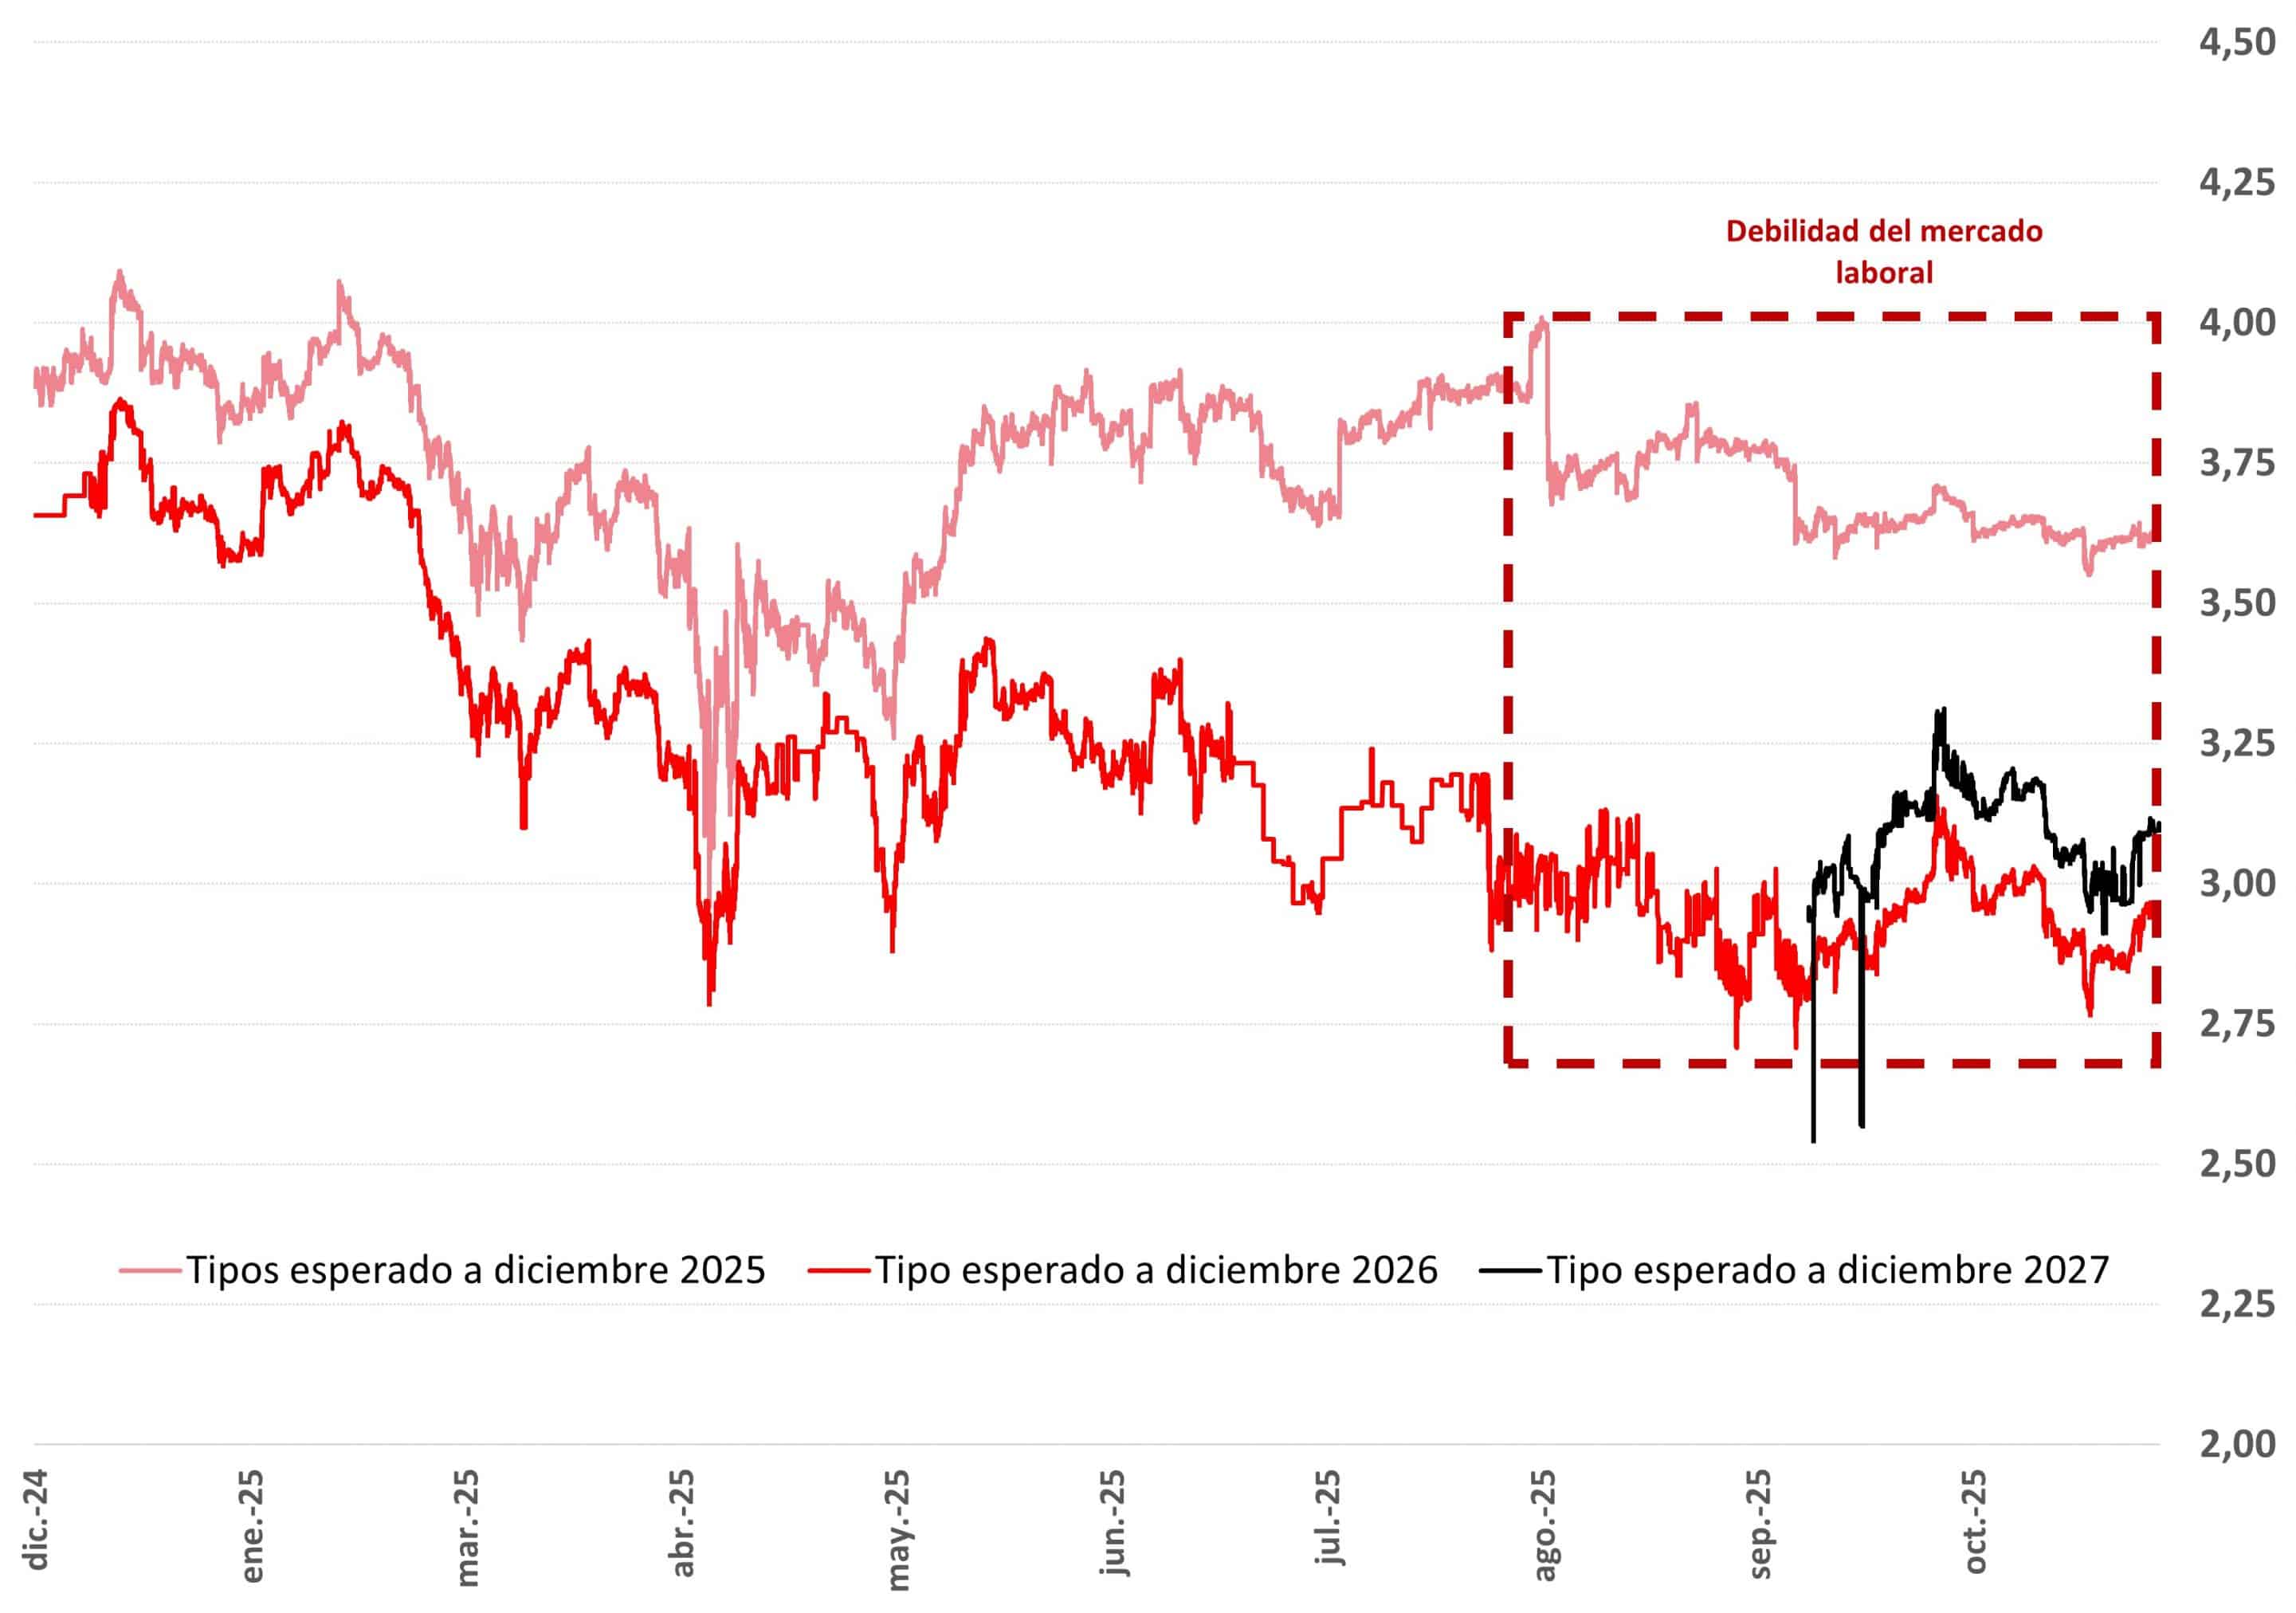
Source: MAPFRE Economics (based on Bloomberg data)