The five key indicators that will determine markets' behaviour

Redacción Mapfre
May ended with a slight recovery in riskier asset prices. However, we should not take this as a change in trend. The main driver of such movement was liquidity, which is also a key variable for macroeconomic developments. I cannot stress enough the importance of changes in liquidity in the current context. It should also be borne in mind that, given the greater complexity of the current context, the view contained in this paper may appear to be an oversimplification. But we think it is a good enough summary.
The macroeconomic scenario
The general environment has not changed much in the last weeks. If anything, every macroeconomic trend we already knew has now intensified. Thus, central banks are now more hawkish than one month ago. In particular, the ECB, which has announced rate hikes in July and September at least. At the same time, inflation prints came out significantly higher than expected. Moreover, expected growth was revised down even more. Consensus among economist and market analysts point to this scenario staying very similar until September/October, and we really cannot see a driver that can change it before, unless something much unexpected happens. Consequently, there is no clear trigger for a change in market trends. We still live in a bearish context, both for bonds and equities.
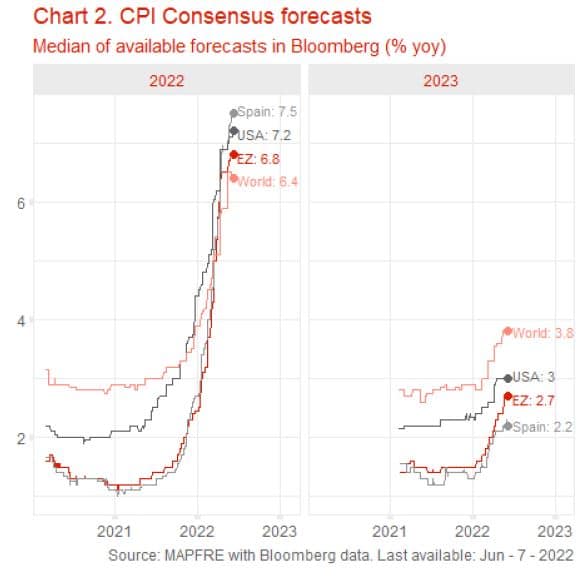
Then, as fall arrives, we can find ourselves in an environment of much weaker activity, as consumption in Europe and investment in the US will have been severely hit by then. At the same time, inflation will start to moderate as year-end approaches, mainly because of a huge base effect. This assumption depends heavily on energy prices not rocketing again before winter, as happened last year. Anyway, expected moderation does not mean inflation will go back to pre-pandemic lows; instead, levels around 3%-4% look quite reasonable. Finally, by October the US Fed and the ECB will have raised rates several times already; and what is much more important, we will have been living in a negative liquidity environment for several weeks. Such a context points to a very significant moderation in central banks’ tone. Consequently, much flatter curves and an end to bearish bonds.
Alternative scenarios
Whereas the above seems the most plausible scenario ahead, and consensus around it is quite high, it is also more uncertain than ever. There are many assumptions that can be challenged easily, and even more non-economic factors that might deviate the outcome. We are not going to list all of them here. However, we can simplify it to two alternative scenarios: a pessimistic one for growth, more likely; and a positive one for activity, but negative for inflation. As can be seen, in the end, none of them seems optimistic for equity markets.
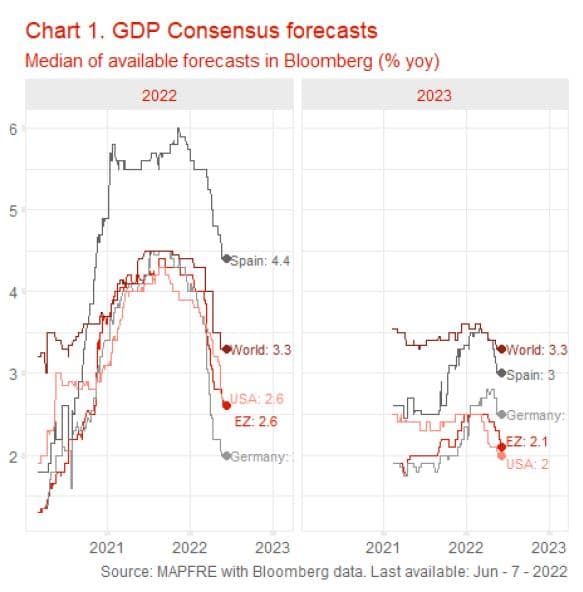
The pessimistic scenario means that, given the current expectation of growth about 2.6% for this year (Bloomberg Consensus as of June 6th, 2022) for both the EU and the US, we’ll fall much lower, even, maybe, in the so-called recession area. Should this happen, it would be clear by the last quarter, and it would bring down earnings expectations and equity multiples. There could be some relief in a less hawkish tone of central banks, but given the current context, there is no chance of returning to liquidity injections to support market prices or economic activity. That would be the outcome of monetary policies chasing a rainbow trying to fight inflation after having printed money like crazy in the last years. So, do not trust them again to support asset prices.
The main triggers of this situation would be the hit to real incomes by inflation and higher rates, a potential fall in real estate markets, sudden increases in energy costs (in this case with even higher inflation) or an expansion of the war, among many others. In this context, equities markets would suffer significantly, but we could find some shelter in the highest rated bond markets. Watch for USD depreciation though.
The other alternative scenario is more positive for growth, but not so for inflation. Economic activity might be supported by low unemployment, post-pandemic confidence and expanding money supply (see next section for explanation) which in turn would lead to real incomes resisting the inflation hit, at least to some extent. At the same time, inflation provoked by supply chains restrictions could foster investment in several key areas, namely energy and technology. All this sounds like utopic now, and admittedly, its likelihood is much lower than the scenario above. But still possible.
The main problem is that inflation would not moderate easily and thus, central banks would turn even more aggressive with their hawkish stance. While equity markets might see some support based on sustained earnings growth, it is limited by the restrictive monetary policy that, moreover, would be very negative for bond markets. To make things worse, the longer this scenario develops, the more likely is a subsequent growth crash. Probably, USD would appreciate very significantly.
Flashing red lights – liquidity is key
Currently there are already some indicators that, in the short term, point to a higher likelihood of the pessimistic alternative. In recent weeks, the main driver of market movements is liquidity changes, which in turn have huge but difficult to assess implications.
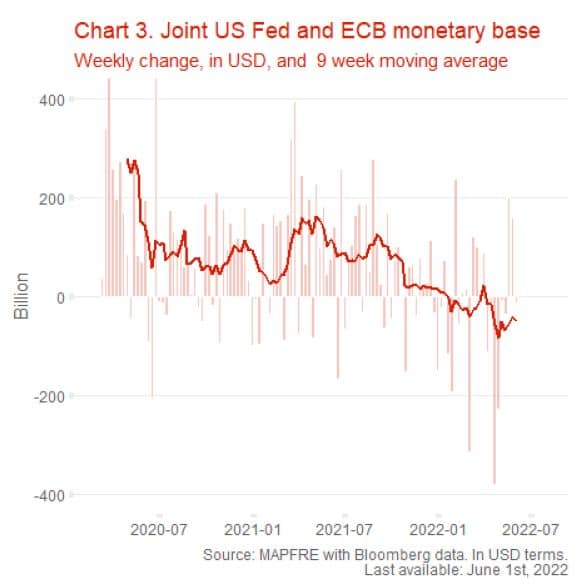
As central banks talk of “ending purchases” in the case of the ECB, or “reducing its balance sheet” in the case of the US Fed, that means simply they are going to slowdown or even reverse the amount of new money they produce. During the pandemic, we grew used to having between USD 100 and USD 200 Bn entering financial markets each week1. In April and the first half of May, we had the sharpest liquidity contraction in more than 40 years (do not be misled by this fact: In the two years before, we’ve had the largest monetary expansion in history). As a result, asset prices fell. Then, during the two last weeks of May, they were supported by new injections. These large weekly swings are related to several different technical issues, being the US Treasury fiscal cycle the most important. However, the trend is clearly negative.
In normal times, the net result of these injections would be neutral. Now, central banks have broadcasted their intention of reducing liquidity as the only tool they have to reduce inflation. This means we must live with a negative net result of this variable. And attending to central bankers’ opinion, very negative, since suddenly, they find themselves in a hurry. This is not good at all for asset prices in general, but particularly for equities. Drivers for bonds are more balanced with inflation, rates expectations and credit quality. This is also important for exchange rates since, for the short term, the currency whose central bank appears to be the most aggressive in reducing liquidity will appreciate the most. For the next 2-3 months, we cannot see a significant change in this dynamic. But, as stated in the first section, it will probably moderate after summer.
The above two paragraphs are talking about liquidity coming from central banks directly into financial markets. Simplifying things again, that is the so-called M0, or central banks’ balance sheets money. And that has been the main driver of asset prices during the last 15 years, but particularly since 2020. Now, for macroeconomic developments, and namely for consumption, the liquidity that matters is the one that reaches citizens’ pockets. This is the so called M2 or M3, which in turn is the result of the M0 passing through the banking system, where it can be expanded by lending. This means that developments in M0 take some time to be mimicked by M2 or M3. Thus, now we are witnessing the M2 expansion that results from the huge printing of money (increase in M0) during the last the las two years.
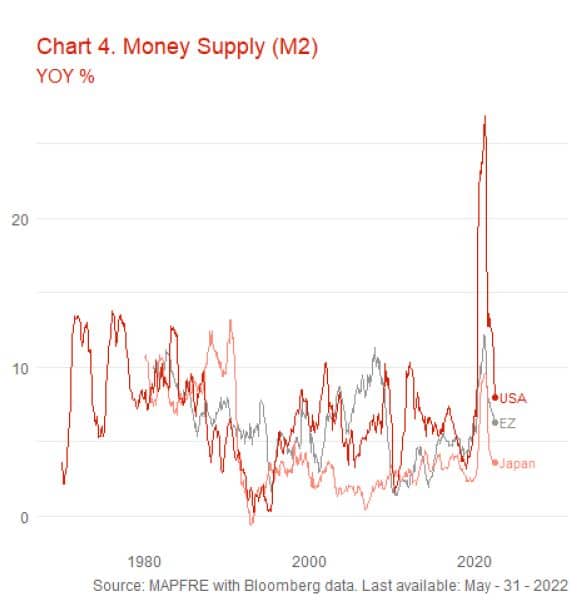
This fact explains the apparent paradox: while central bank liquidity is shrinking, money in people's pockets continues to grow at a very fast pace (see Chart 4). This constitutes one of the main supports for growth and earnings in the short term, along with reduced unemployment. In an ideal world, this effect would counterbalance the impact of inflation on incomes, making these expand enough to pay for the increase in prices. Whether this will happen remains unknown, but it is not likely for social reasons. Usually, even in developed countries, those groups hit the most by inflation are different from the groups firstly benefitted by the increase in M2. This is the result of inequality, caused by, for example, the increase in energy prices caused by the so called “green” energy sources. Therefore, this kind of support to economic activity is not likely to last for long. In a matter of months, M2 will slow to rates more like M0. And this is a big threat to GDP figures, since most recessions in the last 100 years are related to shrinking liquidity.
Thus, liquidity is a big warning light flashing in front of us. Although it is the loudest, it is not the only one. In pure macroeconomic terms there are other two variables that constitute early warnings for growth and asset prices, also flashing in red. The first one is inflation. But because it is high, we already knew that. It is because it is widely based: very high in many countries and in many different components at the same time. The other one is global trade, a key element for markets worldwide. We see data with a big lag (three months) but proxies point to a significant slowdown. At the same time, problems in China also act as an important headwind for global trade2.
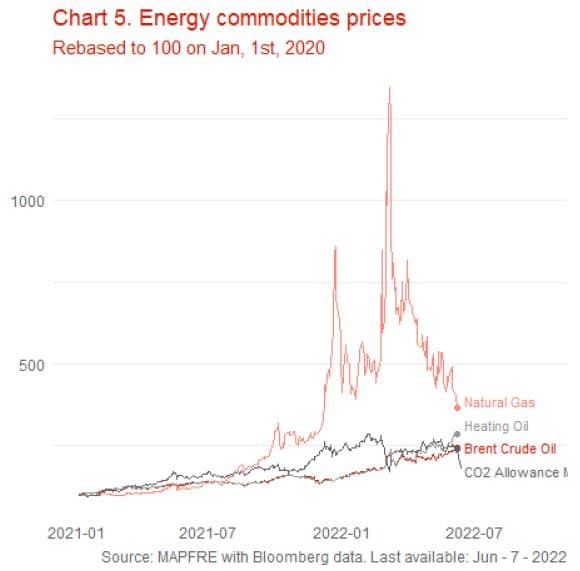
Of the classical five gauges of macro and asset prices, the three above are clearly in a red zone. There is other two that might sound so loud an alarm, but only depending on how we measure them. One of them is uncertainty (or fear, depending on the concept). Metrics of market fear are at their highest, but not so consumer confidence, particularly in Europe. For the short-term consumer demand is staying very high, mostly supported by liquidity and by psychological reasons. If these are the only two backings, the situation will not last. Finally, energy prices, although very high by recent standards, seem to be reaching a ceiling. Should this be true, we could find some relieve in CPIs by year end. But risks are high, ranging from Russia cutting supplies to Europe, to lack of investment in new production or the well-known inability of renewables to satisfy peaks of demand.
What is priced in?
To sum up all the above, the current macro scenario of high inflation, rising interest rates and liquidity draining will last at least some more months. It is very likely that markets will refocus on weak growth after summer. But in this context, out of five important macro and asset prices risk gauges, we have three flashing red, and two not completely red, but close. That makes the alternative scenario of activity much weaker than expected highly likely.
Most of classical metrics of equity markets, like P/E, price to sales, etc. have returned near their long-term average after falls in April and early May. However, expected earnings have hardly been adjusted. This means there is still margin for further adjustments. In the current circumstances, being at the historical average seems insufficient. If activity is to deteriorate more and liquidity will be absent for some time, we should expect these metrics to fall near their lows. Thus, coming months are very risky for equities in general, although there will be plenty of opportunities for careful stock picking. The only argument against this reasoning is the huge liquidity created in recent years, that makes today’s metrics not completely comparable to historical series.
Bond markets seem to be in a more advanced stage of the cycle. The number of hikes priced in the shorter part of the curves seems more than enough in the central scenario. In this sense there is little upside potential in yields, both in Europe and the US. The longer part is riskier. The component associated with growth will press yields down, inflation seems to push the same way, although with more risk. In Europe, the credit component is the riskiest one in an environment of faltering growth and raising rates. So, mind European spreads, although there is a rumor about the ECB trying to backstop them. Anyway, it seems we have reached levels at which we can find opportunities in sovereign fixed income. But don’t hurry. There is still some months to exploit it, maybe at even better prices.
Alberto Matellán, chief economist at MAPFRE Inversión