What is the VIX and why is it so important for the markets?

Redacción Mapfre
The climate of uncertainty has not changed so far this year. The main risks, which are global in scope (the war in Ukraine, the supply crisis, and rising energy costs), have kept investors in an aura of doubt and fear from which it is not easy to emerge. Last week, for instance, we saw episodes of investor panic as a result of the more aggressive tone used by central banks to combat inflation.
Just a month ago, in reaction to adjustments in forecasts of global growth and inflation, experts acknowledged that, given this uncertainty, “the market picture was more difficult to gauge.” Hence, when it comes to making investment decisions the financial sector usually relies on different key data: beyond the price level, the Purchasing Managers' Index (PMI - an economic variable that measures the level of activity in the business environment), or the growth figures themselves, volatility is one of the most important variables for understanding market behavior.
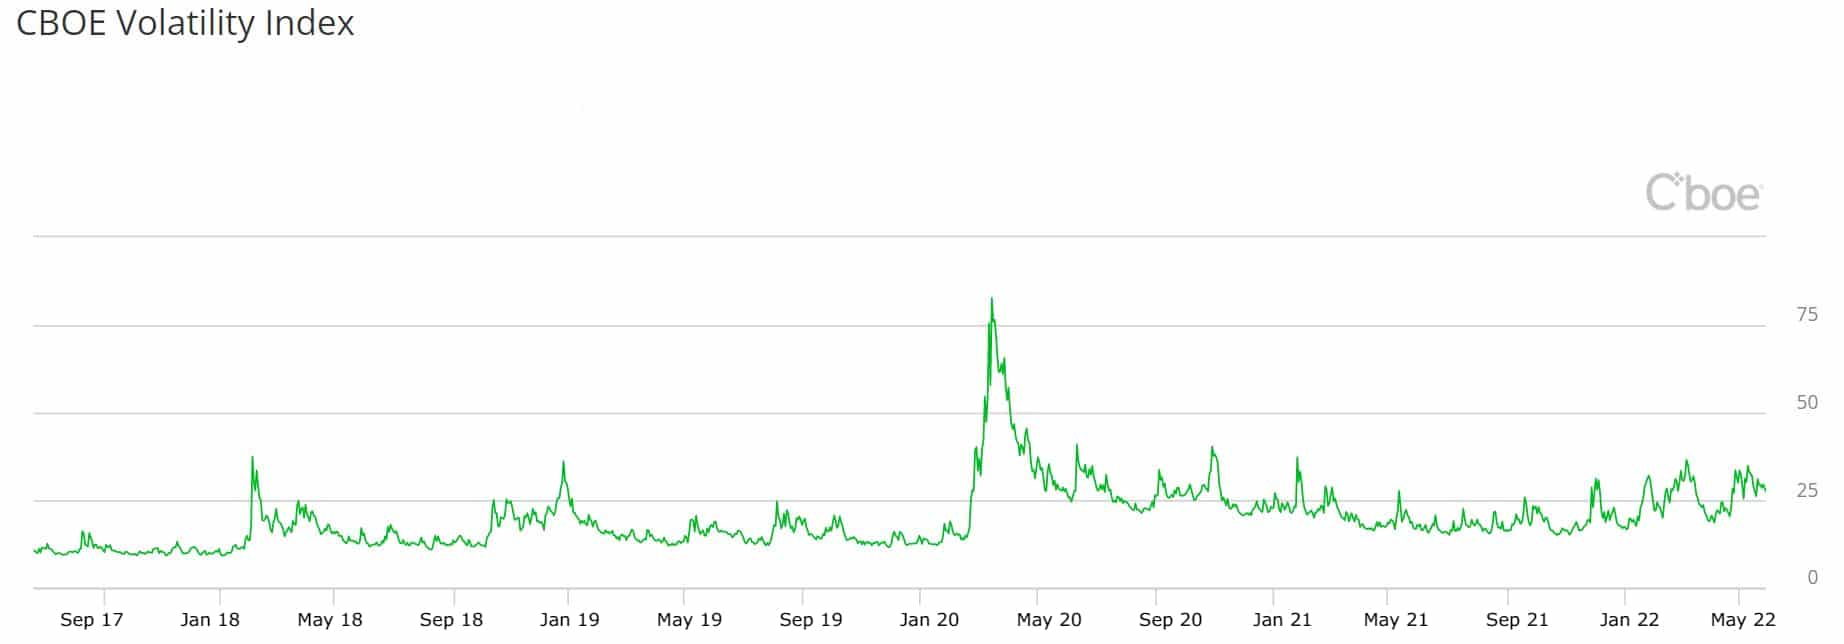
The most representative index of volatility (and widely recognized as such by both the media and market participants) is the VIX. Created by the Chicago Board Options Exchange (CBOE) in 2003, “it is a calculation designed to generate a measure of the expected 30-day constant volatility of the U.S. stock market derived from the average quoted prices of call and put options on the S&P 500 index.”
In other words, the index, also known as the “fear gauge,” attempts to measure investors' opinion of the future volatility of the U.S. stock market over the next 30 days (i.e., how much they believe it will fluctuate over that period of time). Therefore, if the market were to expect higher volatility, investors would be willing to pay more for these hedges (financial options), which would increase the VIX.
From the investor's point of view, it is still a key indicator. According to Javier de Berenguer, fund manager of MAPFRE Gestión Patrimonial, the VIX “speaks of investors' visibility of the economy in the short term and how this may impact the future of the companies on the index.”
In this sense, and returning to what we said above, one of the peculiarities of this figure is its connection with the behavior of the market itself. The VIX and the S&P 500 have an inverse (and easy to explain) relationship:
- Generally, a rise in the VIX implies a fall in the stock markets. This is because a rise in volatility increases risk aversion.
- Conversely, if the VIX falls, this translates into a rise in the markets. Any drop in volatility means less risk and therefore less uncertainty.
As the MGP expert notes, as a general rule, volatility “tends to be higher in bear markets.” This is because “the concept of risk aversion tells us that the intensity of the feeling we experience in the event of a loss is greater than that caused by a gain by the same amount.” This logic is, according to Javier de Berenguer, what drives the VIX to higher levels in bear markets, and that is why it is popularly called “the fear gauge.”
Over the last few years, historical events have also driven the volatility index: in 2001, for example, it reached 60 points; in 2002 (Enron case) it reached 60 points; with the 2008 financial crisis it rose to 79 points; and during the pandemic, it reached an all-time high of 80 points.
But what do each of these numbers mean? The market consensus has assumed that, depending on its level, it can be interpreted as follows:
- 0-15 (Low risk). There is optimism in the market.
- 15-20 (Moderate risk). The market is in business-as-usual.
- 20-25 (Medium risk). This indicates an increase in investor worry.
- 25-30 (High risk). Stock markets are in a situation of turbulence.
- +30 (Very high risk). There is widespread extreme panic.
Are there other indicators for measuring volatility?
There is more than one VIX. Although the U.S. index is the benchmark among investors, there are other indicators to measure the same variable. In Europe, for example, there is the VSTOXX, an index based on the option prices (call and put) of the EURO STOXX 50. Specifically, the VSTOXX is designed to reflect investor sentiment and general economic uncertainty through the 30-day implied volatility of the European index.
But there are also other similar indexes in the European market itself. The German DAX, for example, has its own volatility indicator: the VDAX, created by Deutsche Börse and Goldman Sachs, measures the volatility of stocks listed on the German stock exchange and thus indicates the 30-day implied volatility. Without traveling so far, in Spain there is an index created by BME in 2018 that measures uncertainty in IBEX 35 options: the VIBEX.
Investing in volatility?
The MAPFRE Gestión Patrimonial manager acknowledges that there are ways to invest based on the VIX, but warns that investing in a volatility index ETF is just “another way to speculate on market volatility.” “The traditional way of investing in volatility is options, since a major component of their price is determined by the implied volatility discounted by market participants. So, if an investor thought that volatility was going to be lower or higher than the volatility implicitly calculated in the option price, he or she could profit by trading the option,” he adds.
With respect to the position of an individual investor, he states that “it makes no sense in long-term savings, and only professional managers very occasionally use it as a hedging asset or, more frequently, in volatility strategies (which have volatility limits set in their investment policy).”
That said, de Berenguer believes that volatility investing “is only for expert investors who understand the dynamics of the current market”: “It is a speculative asset because it does not generate cash flows and is not backed by a 'real' asset.”